JeT

I have a set of of functions I keep re-using (as in [this question](https://topanswers.xyz/tex?q=1557)).
**My question**
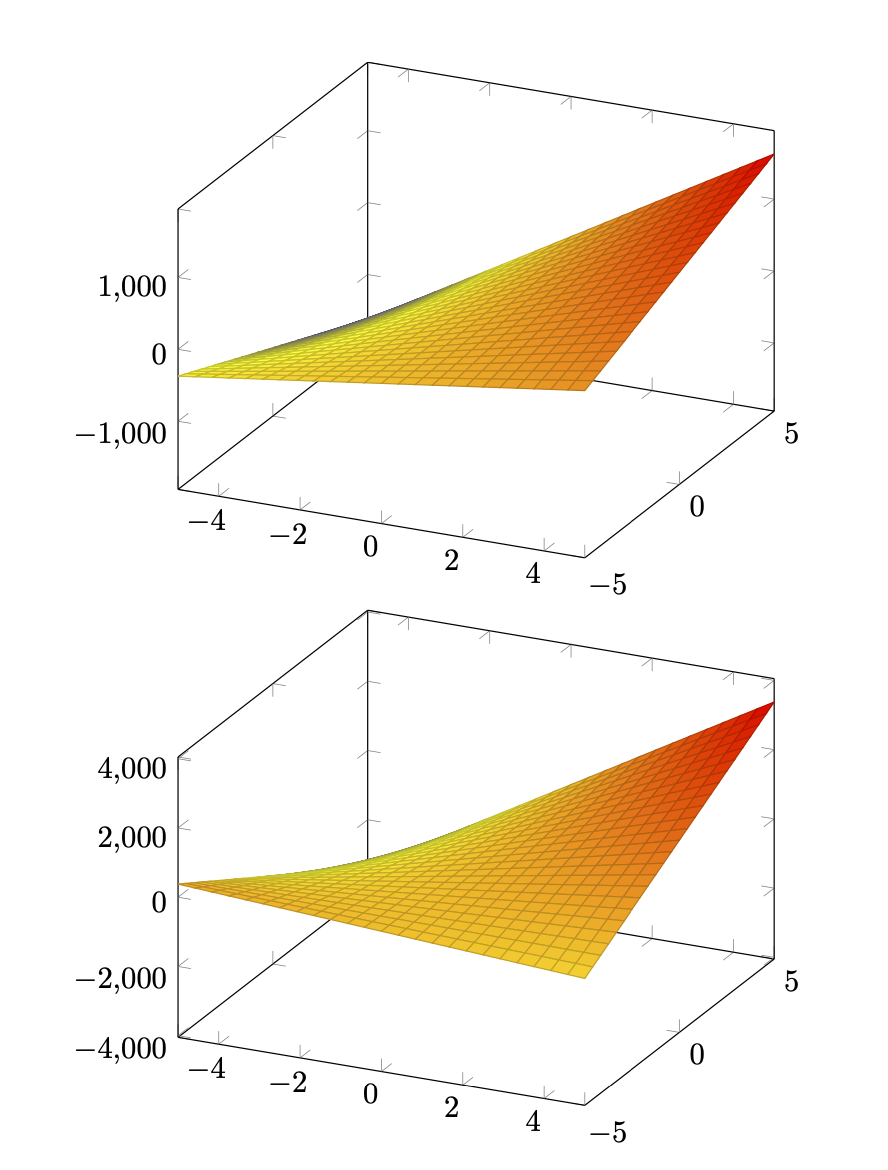
How can I efficiently plot a linear combination of these functions and easily load different scenarios based on different sets of parameters?
**My target**
Easily plot scenarios based on initial values
I feel limited in my analysis to defined sets of variables The heavy/not elegant code makes me think I am dragging a bad habit (I'd like to correct)
I clumsily use (LinearCombination, LC)
`LC(\a,\b,\c,\d,\e,\f)=\a*\d+\b*\e+\c*\f ;`
I need your thoughts to update all this in a civilized way :)

Explanations in the MWE below
**What I do so far**
```
\documentclass{standalone}
\usepackage{pgfplots}
\tikzset{
declare function={ % very basic linear combination
LC(\a,\b,\c,\d,\e,\f)=\a*\d+\b*\e+\c*\f ;
}
}
\begin{document}
% What I do so far
% This long list, not easy to read, no easy to reuse
% It works though. Feels like a 3yo answer (me last year)
\def\WOne{1} \def\KOne{100} \def\RROne{0} \def\VolOne{0.20}
\def\WTwo{\WOne} \def\KTwo{\KOne} \def\RRTwo{\RROne} \def\VolTwo{\VolOne}
\def\WThree{\WOne} \def\KThree{\KOne} \def\RRThree{\RROne}\def\VolThree{\VolOne}
\begin{tikzpicture}
\begin{axis}
\addplot3[surf] {LC(\WOne,\WTwo,\WThree,
\KOne * x + \VolOne * y + \RROne,
\KTwo * x - \VolTwo * y + \RRTwo,
\KThree * x * y * \VolThree + \RRThree
)} ;
\end{axis}
\end{tikzpicture}
%To simplifiy inclusion of the code in my flow I use a macro
\newcommand{\myLC}{
\begin{tikzpicture}
\begin{axis}
\addplot3[surf] {LC(\WOne,\WTwo,\WThree,
\KOne * x + \VolOne * y + \RROne,
\KTwo * x - \VolTwo * y + \RRTwo,
\KThree * x * y * \VolThree + \RRThree
)} ;
\end{axis}
\end{tikzpicture}
}
\myLC{}
% I then have multiple (>15) sets of variables
% Set 1
\def\WOne{1} \def\KOne{100} \def\RROne{0} \def\VolOne{0.20}
\def\WTwo{0} \def\KTwo{0} \def\RRTwo{0} \def\VolTwo{0}
\def\WThree{0} \def\KThree{0} \def\RRThree{0} \def\VolThree{0}
\myLC{}
% Set 2
\def\WOne{1} \def\KOne{100} \def\RROne{0} \def\VolOne{0.20}
\def\WTwo{-1} \def\KTwo{110} \def\RRTwo{0} \def\VolTwo{0.25}
\def\WThree{0} \def\KThree{0} \def\RRThree{0} \def\VolThree{0}
\myLC{}
% Set 3
\def\WOne{1} \def\KOne{100} \def\RROne{0} \def\VolOne{0.20}
\def\WTwo{-2} \def\KTwo{110} \def\RRTwo{0} \def\VolTwo{0.25}
\def\WThree{1} \def\KThree{120}\def\RRThree{0} \def\VolThree{0.30}
\myLC{}
% It does the job... but I know I am wrong.
% What I could do is define my list of variables like this for each set
%Still not super convenient
\tikzset{
declare function={
WOne = 1 ;
WTwo = 1 ;
WThree = WTwo ;
KOne = 100 ;
KTwo = 100 ;
KThree = 100 ;
RROne = 1 ;
RRTwo = 0.50 ;
RRThree = 0.25 ;
TTOne = 1 ;
TTTwo = 0.50 ;
TTThree = 0.25 ;
VolOne = 0.25 ;
VolTwo = 0.25 ;
VolThree = 0.25 ;
}
}
\begin{tikzpicture}
\begin{axis}
\addplot3[surf] {LC(WOne,WTwo,WThree,
KOne * x + VolOne * y + RROne,
KTwo * x - VolTwo * y + RRTwo,
KThree * x * y * VolThree + RRThree
)} ;
\end{axis}
\end{tikzpicture}
% But
% 1 - It's certainly possible (how ?) to name this set of parameters to reuse it in another analysis
% 2 - On the cons side, I would have to change a big chuck of my code with many dependancies cope with this approach.
% I could use a macro to input (some) variables but again, readibility is poor
\newcommand{\mysecondLC}[3]{
\begin{tikzpicture}
\begin{axis}
\addplot3[surf] {LC(#1,#2,#3,
KOne * x + VolOne * y + RROne,
KTwo * x - VolTwo * y + RRTwo,
KThree * x * y * VolThree + RRThree
)} ;
\end{axis}
\end{tikzpicture}
}
\mysecondLC{1}{1}{1}
% I'll be limited to 9 inputs anyway (i'll have more inputs). Still, it's not easy to read....
% I would, again, have to change a big chuck of my code with many dependancies cope with this approach.
\end{document}
```
In a future question, I'll ask how to load a different format (surf, colormap) along the scenario I load. To get easily the kind of output (the real functions I use in my flow)

Top Answer
user 3.14159

This is something rather simple-minded and potentially dangerous, at least if you use it in ways this was not made for. First of all, you can define your set of parameters simply with a style, e.g.
```
\tikzset{JeT-set 1/.style={
declare function={
W1 = 1 ;
W2 = 1 ;
W3 = W2 ;
K1 = 100 ;
K2 = 100 ;
K3 = 100 ;
RR1 = 1 ;
RR2 = 0.50 ;
RR3 = 0.25 ;
TT1 = 1 ;
TT2 = 0.50 ;
TT3 = 0.25 ;
Vol1 = 0.25 ;
Vol2 = 0.25 ;
Vol3 = 0.25 ;
}}
}
```
This means that the functions `W1` and so on are not defined before you (locally) use the style. However, you also want to redefine the functions. pgf "protects" the functions from being simply overwritten, for good reasons. However, this also means that you cannot just redefine `W1`. This is usually not a problem because you are supposed to use such functions locally just once, and then there is no need to redefine them. However, in the case at hand in which you want to make small modifications to a large family of parameters. Therefore I added a key `force declare function` that overwrites functions without complaining. **PLEASE USE WITH CARE**. Using a variant of this style, `redefine`, you can modify parameters of your set.
```
\documentclass{article}
\usepackage{pgfplots}
\pgfplotsset{compat=1.17}
\makeatletter
\pgfkeys{/pgf/force declare function/.code={%
\let\oldpgfmathdeclarefunction@check\pgfmathdeclarefunction@check
\def\pgfmathdeclarefunction@check##1{\pgfmath@declarefunction{##1}}%
\pgfkeys{/pgf/declare function={#1}}%
\let\pgfmathdeclarefunction@check\oldpgfmathdeclarefunction@check
}}
\makeatother
\tikzset{
declare function={ % very basic linear combination
LC(\a,\b,\c,\d,\e,\f)=\a*\d+\b*\e+\c*\f ;
},redefine/.style={force declare function={#1}}}
\begin{document}
\tikzset{JeT-set 1/.style={
declare function={
W1 = 1 ;
W2 = 1 ;
W3 = W2 ;
K1 = 100 ;
K2 = 100 ;
K3 = 100 ;
RR1 = 1 ;
RR2 = 0.50 ;
RR3 = 0.25 ;
TT1 = 1 ;
TT2 = 0.50 ;
TT3 = 0.25 ;
Vol1 = 0.25 ;
Vol2 = 0.25 ;
Vol3 = 0.25 ;
}}
}
\begin{tikzpicture}[JeT-set 1]
\begin{axis}
\addplot3[surf] {LC(W1,W2,W3,
K1 * x + Vol1 * y + RR1,
K2 * x - Vol2 * y + RR2,
K3 * x * y * Vol3 + RR3
)} ;
\end{axis}
\end{tikzpicture}
\newcommand{\myLC}[1][]{%
\begin{tikzpicture}[#1]
\begin{axis}
\addplot3[surf] {LC(W1,W2,W3,
K1 * x + Vol1 * y + RR1,
K2 * x - Vol2 * y + RR2,
K3 * x * y * Vol3 + RR3
)} ;
\end{axis}
\end{tikzpicture}}
%
\myLC[JeT-set 1,redefine={W=1;W2=2;W3=3;}]
%
\end{document}
```

P.S. pgf keys are another option. However, they cannot simply be used in the formulae in the same way as `W1`, say, gets used above. Therefore I decided to play, for the moment, with fire and use the redefining function route.