Anonymous 1123

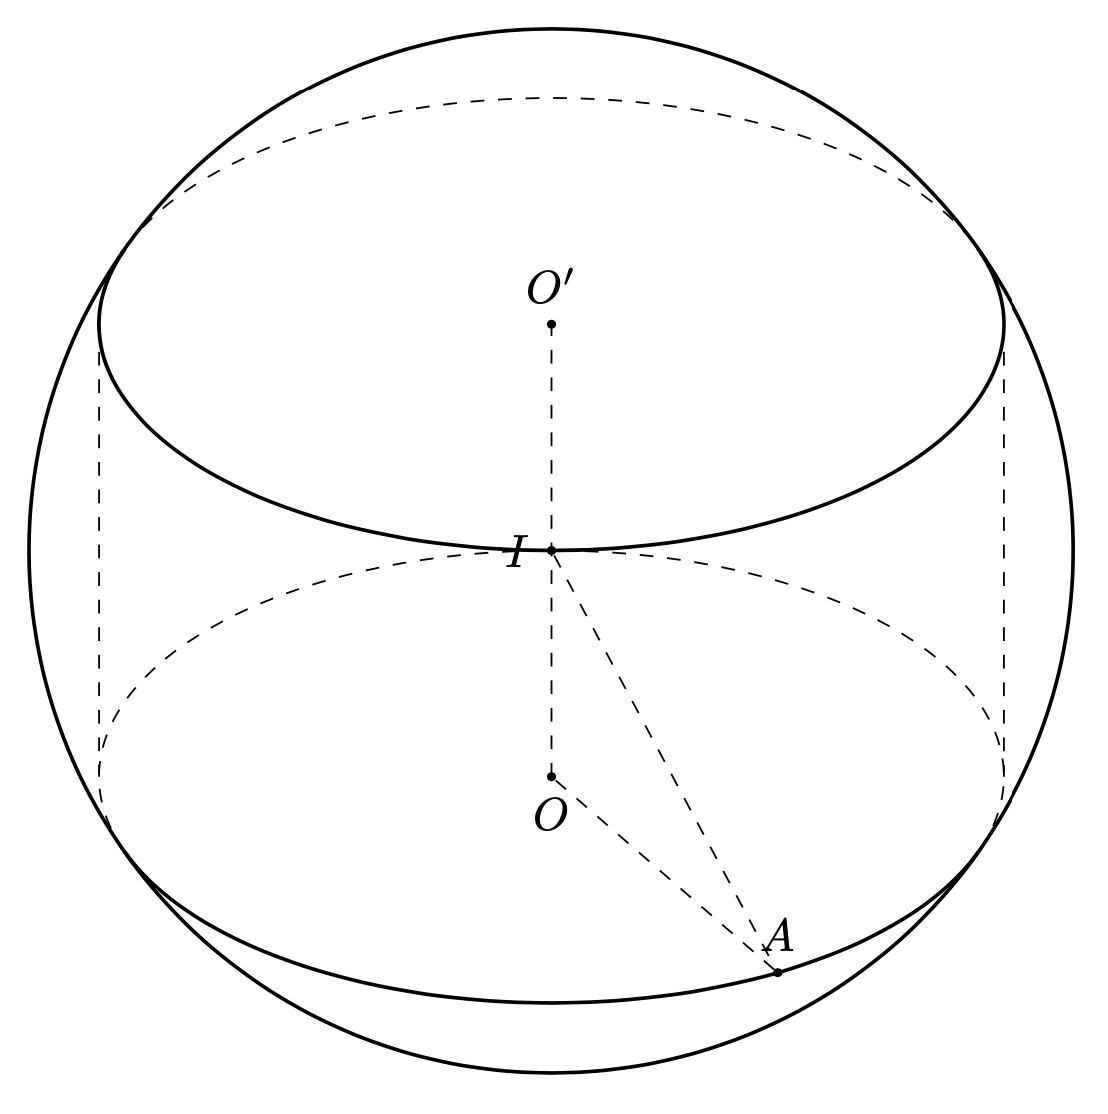
I am tring to draw a cylinder inscribed a sphere. I tried
```
\documentclass[border=2mm,12pt,tikz]{standalone}
\usepackage{tikz-3dplot}
\begin{document}
\def\a{8}%
\def\R{4}%
\def\h{4}%
\pgfmathsetmacro{\myr}{sqrt(\R*\R-\h*\h/4)}
\def\angA{\tdplotmainphi-60}
\tdplotsetmaincoords{60}{60}
\begin{tikzpicture}[tdplot_main_coords,line join = round, line cap = round]
\begin{scope}[canvas is xy plane at z=0]
\coordinate (O) at (0,0);
\coordinate (A) at (\angA:\myr);
\draw[dashed] (\tdplotmainphi:\myr) arc(\tdplotmainphi:\tdplotmainphi+180:\myr);
\draw[thick] (\tdplotmainphi:\myr) coordinate(BR) arc(\tdplotmainphi:\tdplotmainphi-180:\myr) coordinate(BL);
\end{scope}
\begin{scope}[canvas is xy plane at z=\h]
\coordinate (O') at (0,0);
\draw [dashed](BR) -- (\tdplotmainphi:\myr) (BL) -- (\tdplotmainphi-180:\myr);
\draw[dashed] (\tdplotmainphi:\myr) arc(\tdplotmainphi:\tdplotmainphi+180:\myr);
\draw[thick] (\tdplotmainphi:\myr) coordinate(BR) arc(\tdplotmainphi:\tdplotmainphi-180:\myr) coordinate(BL);
\end{scope}
\coordinate (I) at ($ (O) !0.5!(O') $);
\begin{scope}[tdplot_screen_coords]
\draw[thick] (I) circle ({\R});
%\fill[ball color=orange,opacity=1] (T) circle (\myr);
\end{scope}
\foreach \v/\position in {A/below,O/below,O'/above,I/left} {\draw[draw =black, fill=black] (\v) circle (1pt) node [\position=0.2mm] {$\v$};}
\draw[dashed] (O) -- (O') (O) -- (A) (I) -- (A);
\end{tikzpicture}
\end{document}
```
I feel, the picture does not correct. How can I repair it?
Top Answer
user 3.14159

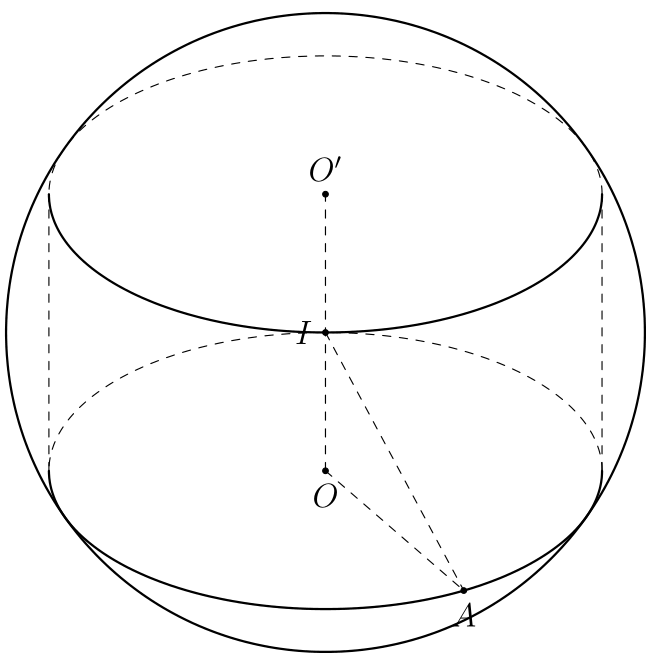
The computation of the critical angles that deterimine the points at which the solid line turns dashed, and vice versa, is identical to the one for [the base of the inscribed cone](https://topanswers.xyz/tex?q=1239#a1472). I also added a more general discussion to the [3dtools manual](https://github.com/marmotghost/tikz-3dtools/blob/master/3DToolsManual.pdf). of The vertical boundaries are correct, I think.
```
\documentclass[border=3mm,tikz,fleqn]{standalone}
\usepackage{tikz-3dplot}
\begin{document}
\tdplotsetmaincoords{60}{60}
\begin{tikzpicture}[tdplot_main_coords, axis/.style={blue,thick},
declare function={R=4;a=8;h=4;r=sqrt(R*R-h*h/4);alpha=\tdplotmainphi-60;},
dot/.style={circle,inner sep=0pt,minimum size=2pt,fill}]
\draw[dashed] (0,0,0) coordinate[dot,label=left:{$I$}] (I)
(0,0,-h/2) coordinate[dot,label=below:{$O$}] (O) --
(0,0,h/2) coordinate[dot,label=above:{$O'$}] (O')
(O) --
({r*cos(alpha)},{r*sin(alpha)},-h/2) coordinate[dot,label=above:{$A$}] (A)
(I) -- (A);
% top circle
\pgfmathsetmacro{\rdiscT}{h/r/2*cot(\tdplotmaintheta)}
\pgfmathtruncatemacro{\itestT}{\rdiscT<-1?2:(\rdiscT>1?1:0)}
\pgfmathsetmacro{\betacritT}{asin(min(1,max(\rdiscT,-1)))}
\typeout{\betacritT,\itestT}
\begin{scope}[canvas is xy plane at z=h/2]
\ifcase\itestT
\draw[dashed] (\tdplotmainphi+180-\betacritT:r)
arc[start angle=\tdplotmainphi+180-\betacritT,
end angle=\tdplotmainphi+\betacritT,radius=r];
\draw[thick] (\tdplotmainphi+180-\betacritT:r)
arc[start angle=\tdplotmainphi+180-\betacritT,
end angle=\tdplotmainphi+\betacritT+360,radius=r];
\or
\draw[thick] (O') circle[radius=r];
\or
\draw[dashed] (O') circle[radius=r];
\fi
\path (\tdplotmainphi:r) coordinate (TR)
(\tdplotmainphi+180:r) coordinate (TL);
\end{scope}
% bottom circle
\pgfmathsetmacro{\rdiscB}{-h/r/2*cot(\tdplotmaintheta)}
\pgfmathtruncatemacro{\itestB}{\rdiscB<-1?2:(\rdiscT>1?1:0)}
\pgfmathsetmacro{\betacritB}{asin(min(1,max(\rdiscB,-1)))}
\typeout{\betacritB,\itestB}
\begin{scope}[canvas is xy plane at z=-h/2]
\ifcase\itestT
\draw[dashed] (\tdplotmainphi+180-\betacritB:r)
arc[start angle=\tdplotmainphi+180-\betacritB,
end angle=\tdplotmainphi+\betacritB,radius=r];
\draw[thick] (\tdplotmainphi+180-\betacritB:r)
arc[start angle=\tdplotmainphi+180-\betacritB,
end angle=\tdplotmainphi+\betacritB+360,radius=r];
\or
\draw[thick] (O) circle[radius=r];
\or
\draw[dashed] (O) circle[radius=r];
\fi
\path (\tdplotmainphi:r) coordinate (BR)
(\tdplotmainphi+180:r) coordinate (BL);
\end{scope}
% vertical lines
\draw[dashed] (TL) -- (BL);
\draw[dashed] (TR) -- (BR);
% sphere
\begin{scope}[tdplot_screen_coords]
\draw[thick] (I) circle[radius=R];
\end{scope}
\end{tikzpicture}
\end{document}
```