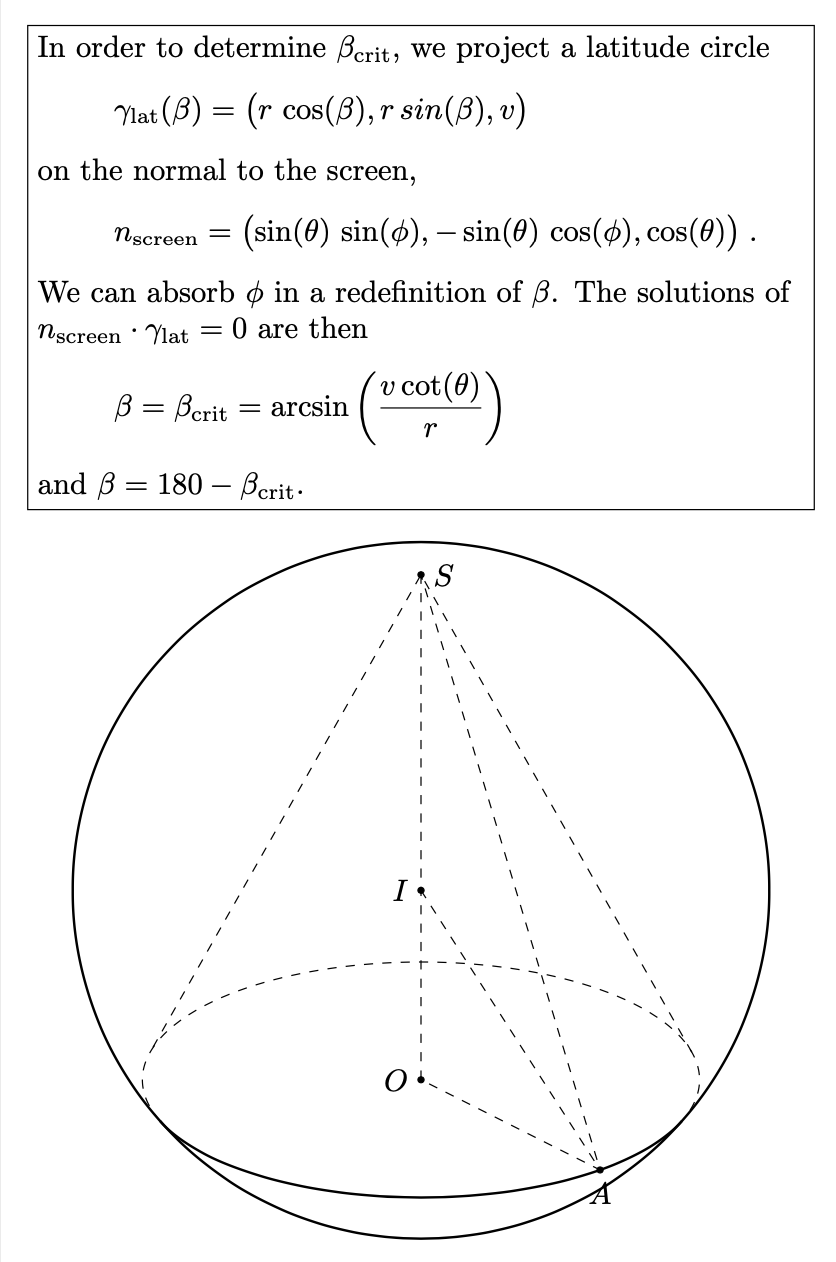
I hope that I interpret the question correctly. In the plane that contains the base of the cone, there are two critical angles.
1. `\alphacrit` is the angle at which the boundary lines that connect the base with the tip attach to the base circle.
2. `\betacrit` is the angle of visibility of the base circle because the rest gets covered by the sphere.
As far as I could see, you only compute `\alphacrit`. I also used the opportunity to shorten the code a bit. For instance, `tikz-3dplot` stores the view angles in `\tdplotmainphi` and `\tdplotmaintheta`, so we do not need to introduce additional macros. I also stored the parameters in functions, which I named according to the description at the beginning of your question.
```
\documentclass[border=3mm,tikz,fleqn]{standalone}
\usepackage{tikz-3dplot}
\usetikzlibrary{backgrounds}
\begin{document}
\tdplotsetmaincoords{65}{110}
\begin{tikzpicture}[tdplot_main_coords, axis/.style={blue,thick},
declare function={%R=3;h=5;r=sqrt(2*h*R-h*h);
R=4;r=R*0.8;h=R+sqrt(R*R-r*r);}]
\path (0,0,0) coordinate (O)
(0,0,h-R) coordinate (I)
({r*cos(60)},{r*sin(60)},0) coordinate (A)
(0,0,h) coordinate (S)
;
\foreach \v/\position in { O/left,A/below,S/right,I/left} {\draw[draw =black, fill=black] (\v) circle (1pt) node [\position=0.2mm] {$\v$};
}
\draw[dashed] (S)--(O) --(A)-- cycle (I) -- (A);
%
\pgfmathsetmacro{\alphacrit}{acos(min(1,max(r*cot(\tdplotmaintheta)/h,-1)))}
\pgfmathsetmacro{\rdisc}{(R-h)/r*cot(\tdplotmaintheta)}
\pgfmathtruncatemacro{\itest}{\rdisc<-1?2:(\rdisc>1?1:0)}
\pgfmathsetmacro{\betacrit}{asin(min(1,max(\rdisc,-1)))}
\typeout{\alphacrit,\betacrit,\itest}
\begin{scope}[canvas is xy plane at z=0]
\draw[dashed] (90+\tdplotmainphi-\alphacrit:r) -- (S)
-- (90+\tdplotmainphi+\alphacrit:r);
\ifcase\itest
\draw[dashed] (\tdplotmainphi+180-\betacrit:r)
arc[start angle=\tdplotmainphi+180-\betacrit,
end angle=\tdplotmainphi+\betacrit,radius=r];
\draw[thick] (\tdplotmainphi+180-\betacrit:r)
arc[start angle=\tdplotmainphi+180-\betacrit,
end angle=\tdplotmainphi+\betacrit+360,radius=r];
\or
\draw[thick] (O) circle[radius=r];
\or
\draw[dashed] (O) circle[radius=r];
\fi
\end{scope}
\begin{scope}[tdplot_screen_coords, on background layer]
\draw[thick] (I) circle[radius=R];
\end{scope}
\path (current bounding box.north)
node[draw,above=1em,text width={2.2*R*1cm}]{%
In order to determine $\beta_\mathrm{crit}$, we project a latitude circle
\[\gamma_\mathrm{lat}(\beta)=\bigl(r\,\cos(\beta),r\,sin(\beta),v\bigr)\]
on the normal to the screen,
\[n_\mathrm{screen}
= \bigl(\sin(\theta)\,\sin(\phi), -\sin(\theta)\,\cos(\phi),
\cos(\theta)\bigr)\;.
\]
We can absorb $\phi$ in a redefinition of $\beta$. The solutions of
$n_\mathrm{screen}\cdot\gamma_\mathrm{lat}=0$ are then
\[ \beta=\beta_\mathrm{crit}=\arcsin\left(\frac{v \cot
(\theta )}{r}\right)\]
and $\beta=180-\beta_\mathrm{crit}$.};
\end{tikzpicture}
\end{document}
```

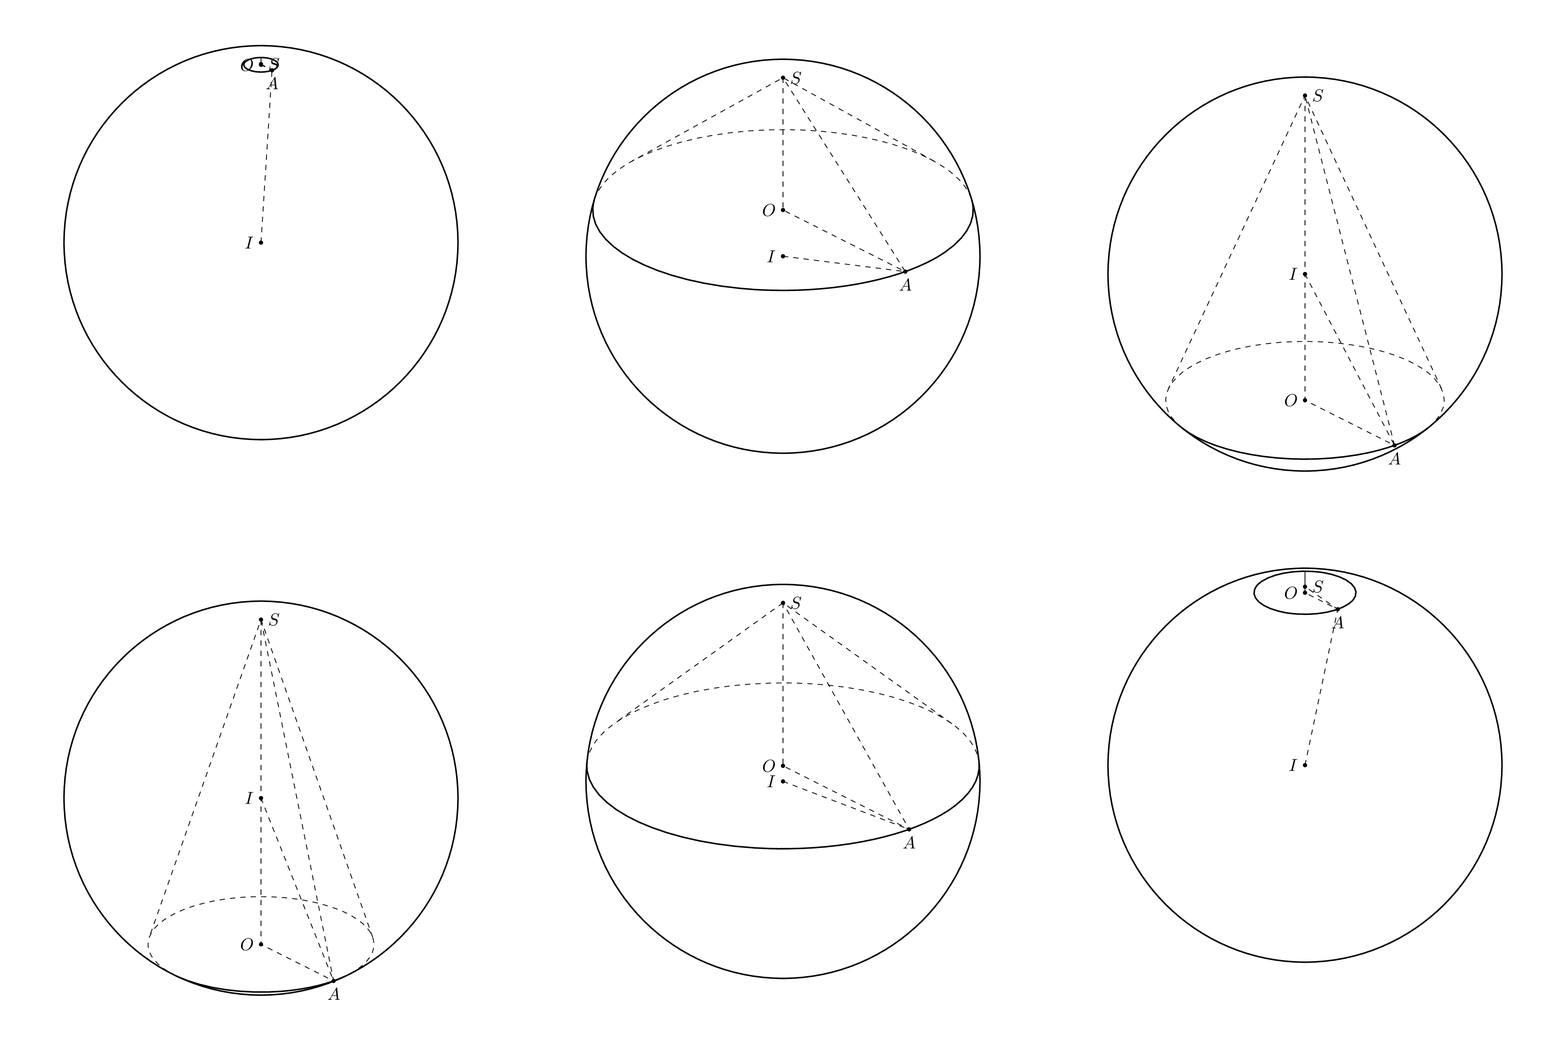
The role of `\betacrit` (and the cases distinguished by `\itest`) is to draw the base circle only on the forefront of the sphere. The following animation is supposed to illustrate this.
```
\documentclass[border=3mm,tikz]{standalone}
\usepackage{tikz-3dplot}
\usetikzlibrary{backgrounds}
\begin{document}
\tdplotsetmaincoords{65}{110}
\foreach \Lat in {-85,-75,...,85,75,65,...,-75}
{\begin{tikzpicture}[tdplot_main_coords, axis/.style={blue,thick},
declare function={%R=3;h=5;r=sqrt(2*h*R-h*h);
R=4;r=R*abs(cos(\Lat));h=R+sin(\Lat)*R;}]
\path[tdplot_screen_coords] (-R-1,h-2*R-1) rectangle (R+1,h+1);
\path (0,0,0) coordinate (O)
(0,0,h-R) coordinate (I)
({r*cos(60)},{r*sin(60)},0) coordinate (A)
(0,0,h) coordinate (S)
;
\foreach \v/\position in { O/left,A/below,S/right,I/left} {\draw[draw =black, fill=black] (\v) circle (1pt) node [\position=0.2mm] {$\v$};
}
\draw[dashed] (S)--(O) --(A)-- cycle (I) -- (A);
\pgfmathsetmacro\alphacrit{acos(min(1,max(r*cot(\tdplotmaintheta)/h,-1)))}
\pgfmathsetmacro{\rdisc}{(R-h)/r*cot(\tdplotmaintheta)}
\pgfmathtruncatemacro{\itest}{\rdisc<-1?2:(\rdisc>1?1:0)}
\pgfmathsetmacro{\betacrit}{asin(min(1,max(\rdisc,-1)))}
\typeout{\alphacrit,\betacrit,\itest}
\begin{scope}[canvas is xy plane at z=0]
\draw[dashed] (90+\tdplotmainphi-\alphacrit:r) -- (S)
-- (90+\tdplotmainphi+\alphacrit:r);
\ifcase\itest
\draw[dashed] (\tdplotmainphi+180-\betacrit:r)
arc[start angle=\tdplotmainphi+180-\betacrit,
end angle=\tdplotmainphi+\betacrit,radius=r];
\draw[thick] (\tdplotmainphi+180-\betacrit:r)
arc[start angle=\tdplotmainphi+180-\betacrit,
end angle=\tdplotmainphi+\betacrit+360,radius=r];
\or
\draw[thick] (O) circle[radius=r];
\or
\draw[dashed] (O) circle[radius=r];
\fi
\end{scope}
\begin{scope}[tdplot_screen_coords, on background layer]
\draw[thick] (I) circle[radius=R];
\end{scope}
\end{tikzpicture}}
\end{document}
```
