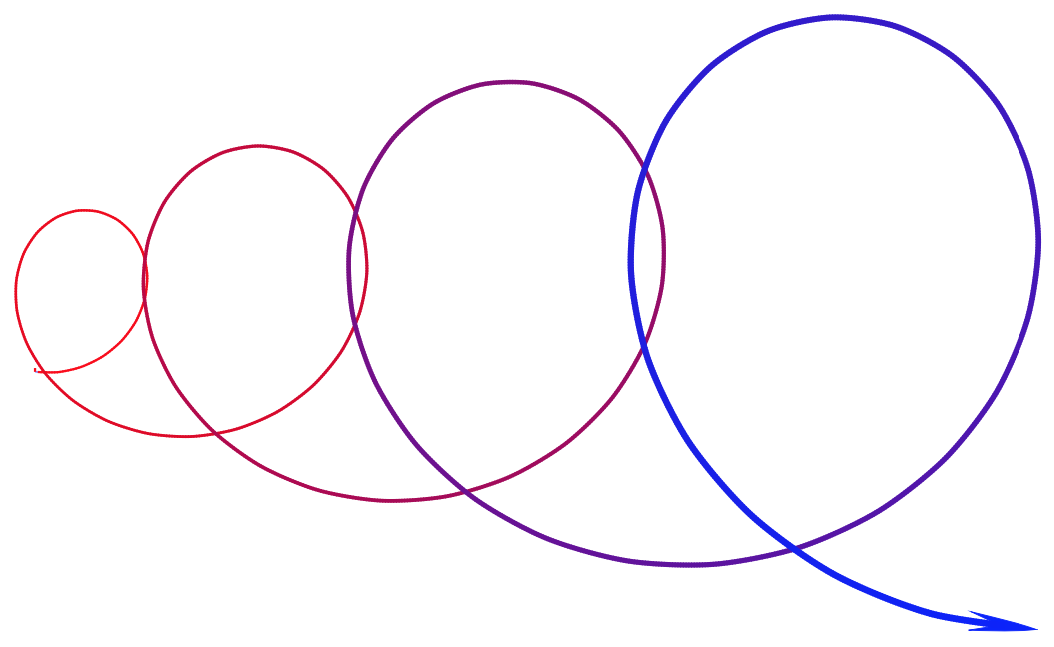
How about this one?
```
\documentclass[tikz,border=3mm]{standalone}
\usepackage{pgfplots}
\pgfplotsset{compat=1.16}
\begin{document}
\begin{tikzpicture}
\begin{axis}[hide axis,colormap={bluered}{color=(red) color=(blue)}]
\addplot[domain=0:4,samples=401,smooth,very thick,mesh,point meta=y]
({1.5*(x+0.4*x*x)+x*sin(x*360)},{-x*cos(360*x)});
\end{axis}
\end{tikzpicture}
\end{document}
```
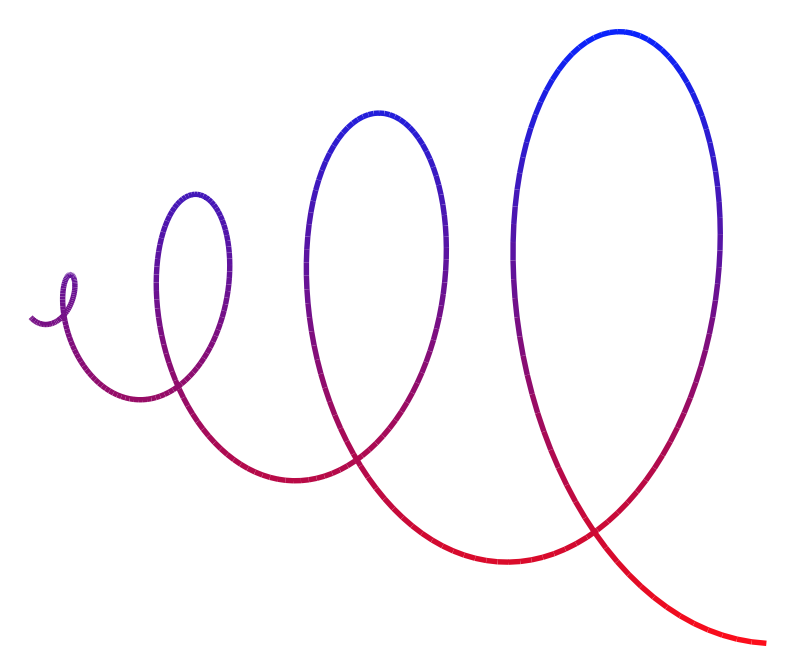
Another way to get the color gradient is to use `path fading`.
```
\documentclass[border=3mm]{standalone}
\usepackage{tikz}
\usetikzlibrary{fadings,calc,arrows.meta,bending}
\begin{document}
\begin{tikzfadingfrompicture}[name=temp]
\begin{scope}[local bounding box=pft]
\draw[transparent!0,-{Stealth[length=3mm,width=3.2mm,bend]},line width=1.2pt]
plot[variable=\x,domain=-0.15:4,smooth,samples=91]
({1.5*(\x+0.5*\x*\x)+(1+\x)*sin(\x*360)},{-(1+\x)*cos(360*\x)});
\end{scope}
\end{tikzfadingfrompicture}%
\begin{tikzpicture}
\path[path fading=temp,fit fading=false,top color=blue,bottom color=red]
let \p1=($(pft.north east)-(pft.south west)$) in
(-\x1/2,-\y1/2) rectangle ++(\x1,\y1);
\end{tikzpicture}
\end{document}
```
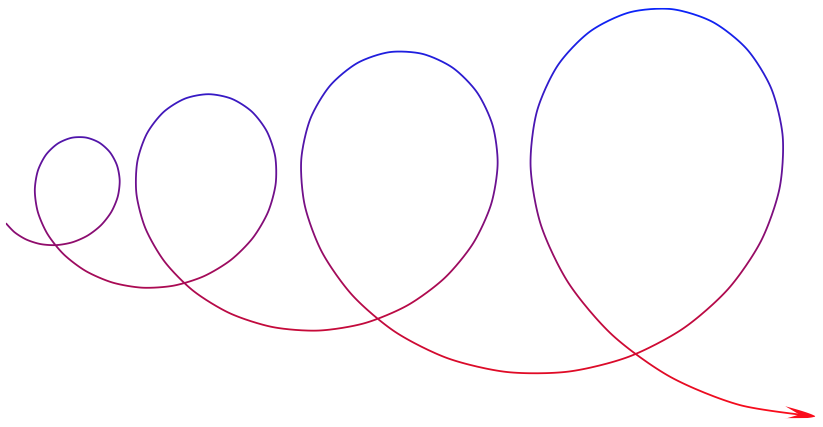
You can also use `decorations` and Ti*k*Z, but the solution is very fragile because one can easily get `dimension too large` errors.
```
\documentclass[tikz,border=3mm]{standalone}
\usetikzlibrary{decorations,arrows.meta,bending}
\begin{document}
\pgfkeys{/pgf/decoration/.cd,
start color/.store in=\startcolor,
start color=black,
end color/.store in=\endcolor,
end color=black,
varying line width steps/.initial=100
}
\pgfdeclaredecoration{width and color change}{initial}{
\state{initial}[width=0pt, next state=line, persistent precomputation={%
\pgfmathparse{\pgfdecoratedpathlength/\pgfkeysvalueof{/pgf/decoration/varying line width steps}}%
\let\increment=\pgfmathresult%
\def\x{0}%
}]{}
\state{line}[width=\increment pt, persistent postcomputation={%
\pgfmathsetmacro{\x}{\x+\increment}
},next state=line]{%
\pgfmathparse{ifthenelse(\x<\pgfdecoratedpathlength-5mm,varyinglw(100*(\x/\pgfdecoratedpathlength)),
varyinglw(100*((\pgfdecoratedpathlength-5mm)/\pgfdecoratedpathlength))*(\pgfdecoratedpathlength-\x)/14) )}
\pgfsetlinewidth{\pgfmathresult pt}%
\pgfpathmoveto{\pgfpointorigin}%
\pgfmathsetmacro{\steplength}{1.4*\increment}
\pgfpathlineto{\pgfqpoint{\steplength pt}{0pt}}%
\pgfmathsetmacro{\y}{100*(\x/\pgfdecoratedpathlength)}
\pgfsetstrokecolor{\endcolor!\y!\startcolor}%
\pgfusepath{stroke}%
}
\state{final}{%
\pgfsetlinewidth{\pgflinewidth}%
\pgfpathmoveto{\pgfpointorigin}%
\pgfmathsetmacro{\y}{100*(\x/\pgfdecoratedpathlength)}
\color{\endcolor!\y!\startcolor}%
\pgfusepath{stroke}%
}
}
\begin{tikzpicture}[varying arrow/.style={-{Stealth[length=4mm,width=3.2mm,bend]},color=\endcolor,
postaction={/utils/exec=\pgfsetarrows{-},decorate,decoration={width and color change}}
}]
\begin{scope}[declare function={varyinglw(\x)=1+2*\x/100;}]
\draw[varying arrow,/pgf/decoration/varying line width steps=1801,
/pgf/decoration/start color=red,/pgf/decoration/end color=blue]
plot[variable=\x,domain=0:4,smooth,samples=91]
({1.5*(\x+0.4*\x*\x)+(1+\x)*sin(\x*360)},{-(1+\x)*cos(360*\x)});
\end{scope}
\end{tikzpicture}
\end{document}
```