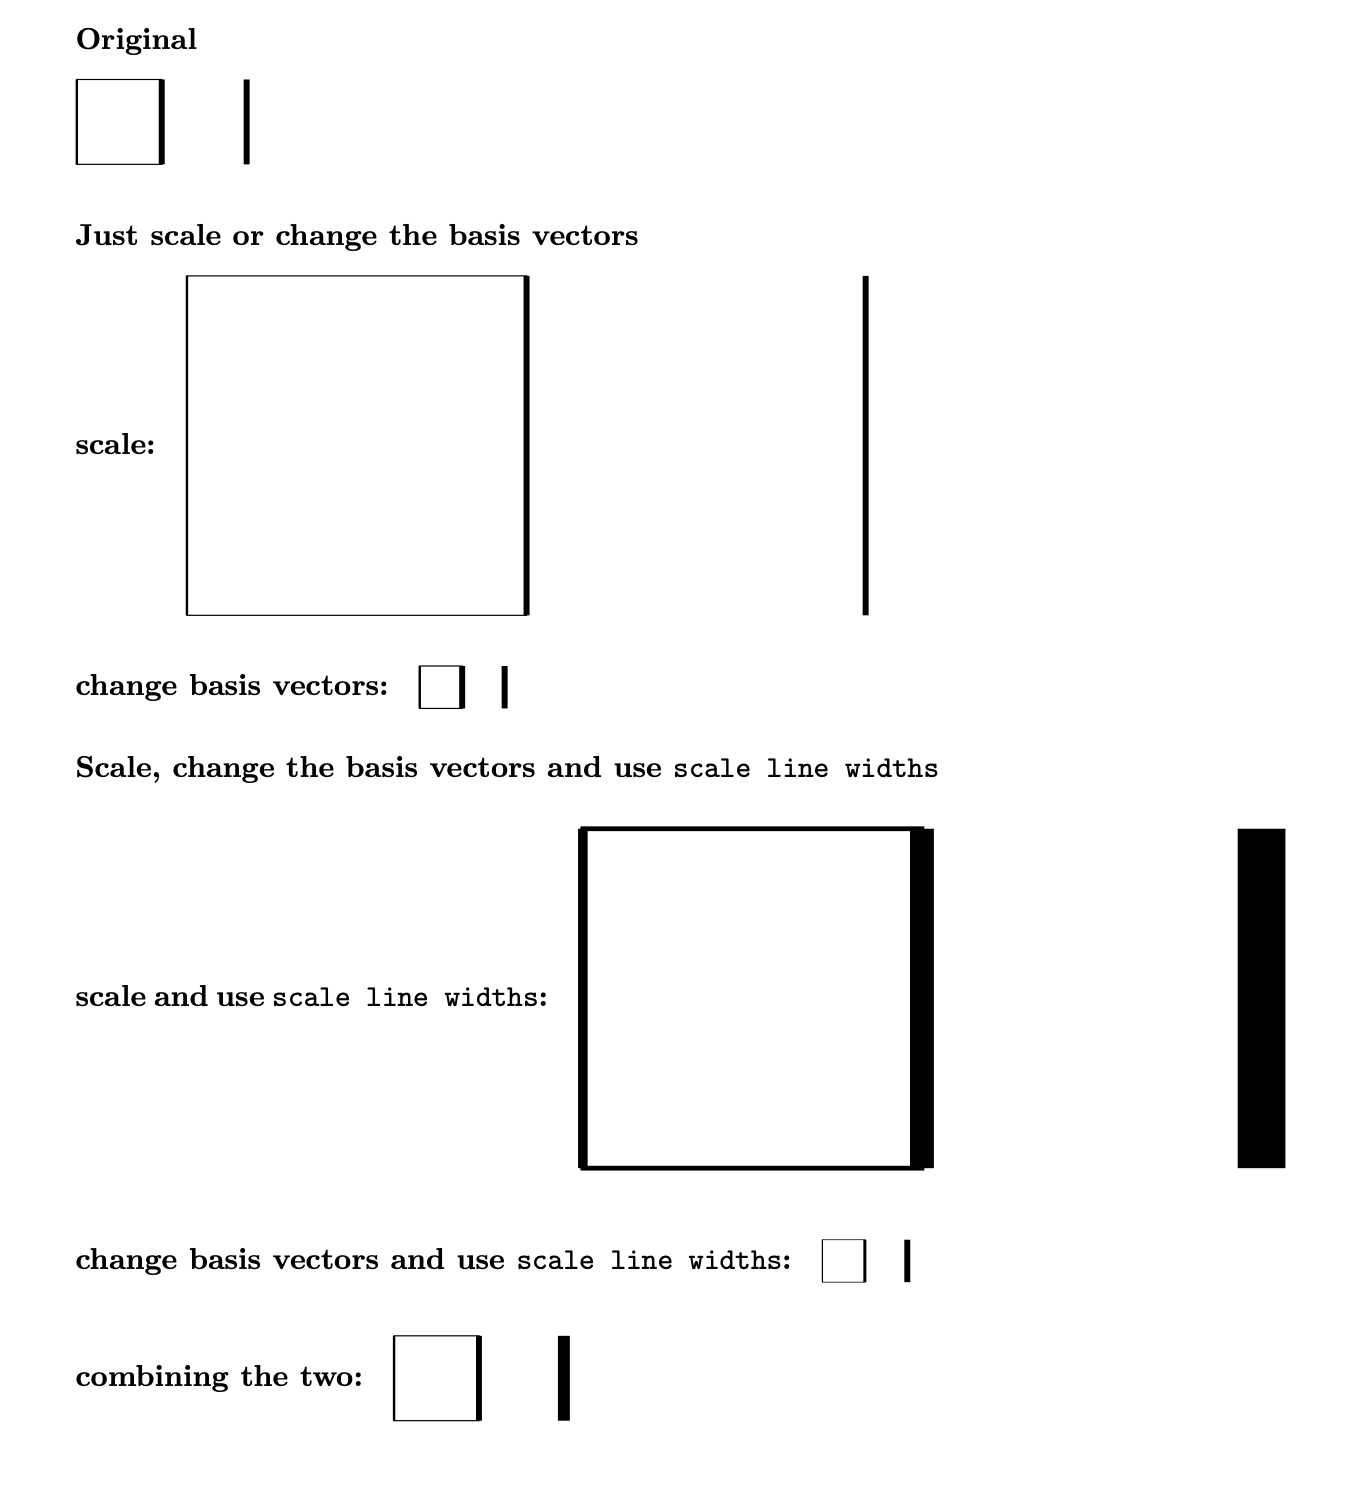
This answer assumes that you are dealing with 2d pictures only. Then the basis vectors are stored in `e_x=(\pgf@xx,\pgf@xy)` and `e_y=(\pgf@yx,\pgf@yy)`. This means that there is a second Jacobian, on top of the one you are computing. The following code defines a key `scale line widths` which uses both Jacobians to scale the line width.
```
\documentclass{article}
\usepackage{tikz}
\makeatletter
\tikzset{scale line widths/.code={%
\def\tikz@semiaddlinewidth##1{%
\pgfgettransformentries{\tmpa}{\tmpb}{\tmpc}{\tmpd}{\tmp}{\tmp}%
\pgfmathsetmacro{\myJacobian}{sqrt(abs(\tmpa*\tmpd-\tmpb*\tmpc))*%
sqrt(abs((\pgf@xx/1cm)*(\pgf@yy/1cm)-(\pgf@xy/1cm)*(\pgf@yx/1cm)))}%
\pgfmathsetlength\pgflinewidth{\myJacobian*0.4pt}%
\pgfmathsetmacro{\my@lw}{\myJacobian*##1}%
\tikz@addoption{\pgfsetlinewidth{\my@lw pt}}%
\pgfmathsetlength\pgflinewidth{\my@lw pt}}%
\tikzset{thin}}%
}
\makeatother
\newcommand\CenterObject[1]{$\vcenter{\hbox{#1}}$}
\begin{document}
\subsubsection*{Original}
\begin{tikzpicture}
\draw (0,0) rectangle (1,1);
\draw[thick] (0,0) -- (0,1);
\draw[line width=2pt] (1,0) -- (1,1);
\begin{scope}[scale=2]
\draw[line width=2pt] (1,0) -- (1,0.5);
\end{scope}
\end{tikzpicture}
\subsubsection*{Just scale or change the basis vectors}
\paragraph{scale:}\CenterObject{\begin{tikzpicture}[scale=4]
\draw (0,0) rectangle (1,1);
\draw[thick] (0,0) -- (0,1);
\draw[line width=2pt] (1,0) -- (1,1);
\begin{scope}[scale=2]
\draw[line width=2pt] (1,0) -- (1,0.5);
\end{scope}
\end{tikzpicture}}
\paragraph{change basis vectors:}\CenterObject{\begin{tikzpicture}[x=5mm,y=5mm]
\draw (0,0) rectangle (1,1);
\draw[thick] (0,0) -- (0,1);
\draw[line width=2pt] (1,0) -- (1,1);
\begin{scope}[scale=2]
\draw[line width=2pt] (1,0) -- (1,0.5);
\end{scope}
\end{tikzpicture}}
\subsubsection*{Scale, change the basis vectors and use \texttt{scale line widths}}
\paragraph{scale and use \texttt{scale line widths}:}\CenterObject{\begin{tikzpicture}[scale=4,scale line widths]
\draw (0,0) rectangle (1,1);
\draw[thick] (0,0) -- (0,1);
\draw[line width=2pt] (1,0) -- (1,1);
\begin{scope}[scale=2]
\draw[line width=2pt] (1,0) -- (1,0.5);
\end{scope}
\end{tikzpicture}}
\paragraph{change basis vectors and use \texttt{scale line widths}:}%
\CenterObject{\begin{tikzpicture}[x=5mm,y=5mm,scale line widths]
\draw (0,0) rectangle (1,1);
\draw[thick] (0,0) -- (0,1);
\draw[line width=2pt] (1,0) -- (1,1);
\begin{scope}[scale=2]
\draw[line width=2pt] (1,0) -- (1,0.5);
\end{scope}
\end{tikzpicture}}
\paragraph{combining the two:}\CenterObject{\begin{tikzpicture}[scale=2,x=5mm,y=5mm,scale line widths]
\draw (0,0) rectangle (1,1);
\draw[thick] (0,0) -- (0,1);
\draw[line width=2pt] (1,0) -- (1,1);
\begin{scope}[scale=2]
\draw[line width=2pt] (1,0) -- (1,0.5);
\end{scope}
\end{tikzpicture}}
\end{document}
```

Notice that the line in a scope with an additional scale factor has been added on purpose to hint at possible pitfalls.