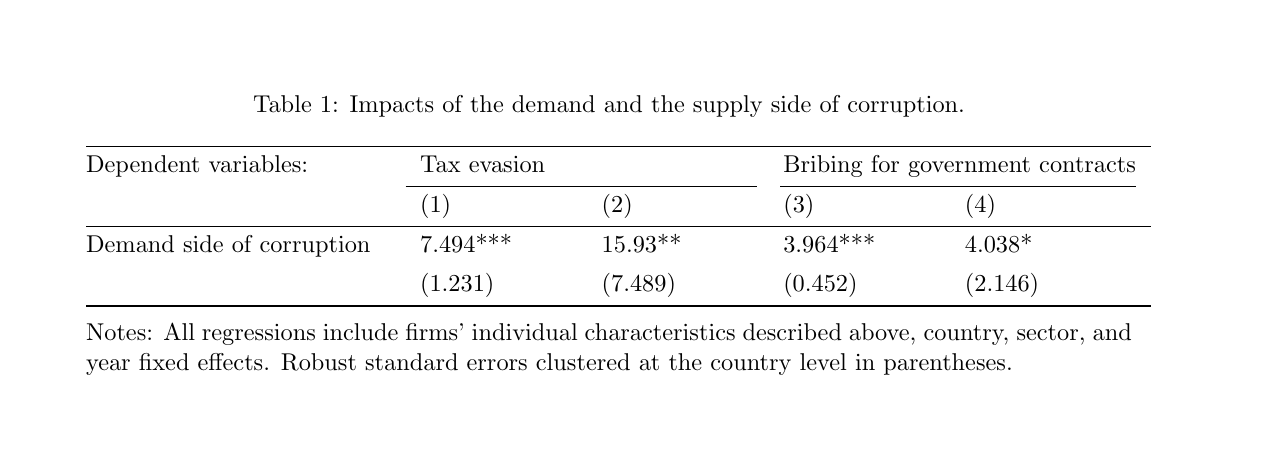
Anonymous 13970

I would love to recreate this table on latex but I don't know how. Does someone know how to? 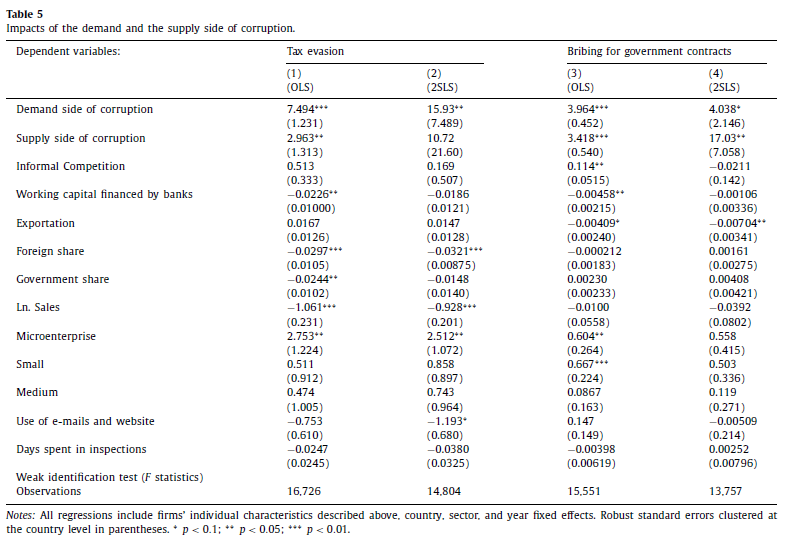
Top Answer
samcarter

You could use the `tabularray` package. Here a short example to get you started:
```
\documentclass{article}
\usepackage{caption}
\usepackage{geometry}
\usepackage{tabularray}
\UseTblrLibrary{booktabs}
\begin{document}
\begin{table}[htbp]
\caption{Impacts of the demand and the supply side of corruption.}
\begin{tblr}{
colspec={@{}X[2]XXXX@{}}
}
\toprule
Dependent variables: & \SetCell[c=2]{} Tax evasion && \SetCell[c=2]{} Bribing for government contracts &\\
\cmidrule[r]{2-3}\cmidrule[l]{4-5}
& (1) & (2) & (3) & (4)\\
\midrule
Demand side of corruption & 7.494*** & 15.93** & 3.964*** & 4.038*\\
& (1.231) & (7.489) & (0.452) & (2.146)\\
\bottomrule
\end{tblr}
\medskip
Notes: All regressions include firms' individual characteristics described above, country, sector, and year fixed effects. Robust standard errors clustered at the country level in parentheses.
\end{table}
\end{document}
```
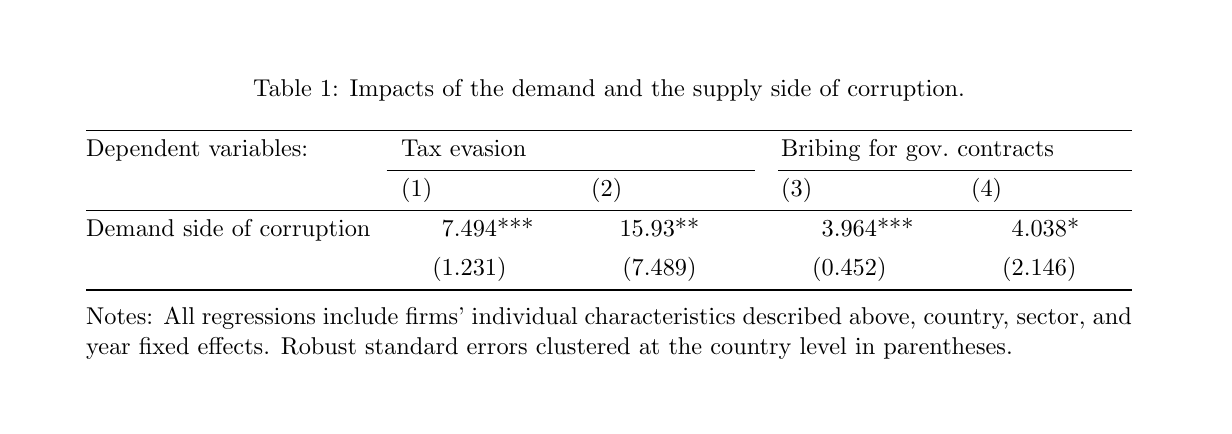
In case you'd like to align all the numbers with respect to their decimal markers, you could use the siunitx package:
```
\documentclass{article}
\usepackage{caption}
\usepackage{geometry}
\usepackage{tabularray}
\UseTblrLibrary{booktabs}
\UseTblrLibrary{siunitx}
\begin{document}
\begin{table}[htbp]
\caption{Impacts of the demand and the supply side of corruption.}
\begin{tblr}{
colspec={
@{}
X*{4}{
Q[si={
table-format=-2.5,
table-alignment=left,
table-space-text-post=***,
table-align-text-post=false,
table-space-text-pre=(,
table-align-text-pre=false,
input-open-uncertainty=,
input-close-uncertainty=,
}]
}@{}
},
row{1,2} = {guard}
}
\toprule
Dependent variables: & \SetCell[c=2]{} Tax evasion && \SetCell[c=2]{} Bribing for gov.\ contracts &\\
\cmidrule[r]{2-3}\cmidrule[l]{4-5}
& (1) & (2) & (3) & (4)\\
\midrule
Demand side of corruption & 7.494*** & 15.93** & 3.964*** & 4.038*\\
& (1.231) & (7.489) & (0.452) & (2.146)\\
\bottomrule
\end{tblr}
\medskip
Notes: All regressions include firms' individual characteristics described above, country, sector, and year fixed effects. Robust standard errors clustered at the country level in parentheses.
\end{table}
\end{document}
```
Answer #2
Skillmon

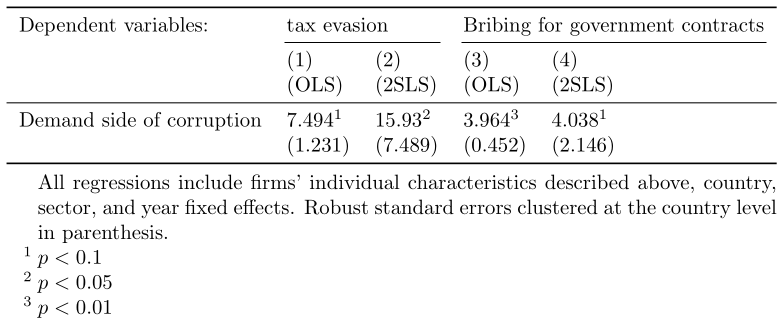
Just the first few rows and the notes, using standard `tabular` inside of `threeparttable` and `booktabs` for the rules:
```
\documentclass{article}
\usepackage{booktabs,threeparttable}
\begin{document}
\begin{threeparttable}
\begin{tabular}{*5l}
\toprule
Dependent variables: & \multicolumn{2}{l}{tax evasion}
& \multicolumn{2}{l}{Bribing for government contracts} \\
\cmidrule(lr){2-3}
\cmidrule(lr){4-5}
& (1) & (2) & (3) & (4) \\
& (OLS) & (2SLS) & (OLS) & (2SLS) \\
\midrule
Demand side of corruption & 7.494\tnote{1} & 15.93\tnote{2} & 3.964\tnote{3}
& 4.038\tnote{1} \\
& (1.231) & (7.489) & (0.452) & (2.146) \\
\bottomrule
\end{tabular}
\begin{tablenotes}
\item All regressions include firms' individual characteristics described
above, country, sector, and year fixed effects. Robust standard errors
clustered at the country level in parenthesis.
\item[1] $p < 0.1$
\item[2] $p < 0.05$
\item[3] $p < 0.01$
\end{tablenotes}
\end{threeparttable}
\end{document}
```