add tag
JohnPaul
I am trying to set up ymin and ymax to a `tikzpicture`. In this code, I input by hand 
```
ymin=-1 ; ymax=max(y1,y2) + 1;
```

```
\documentclass[12pt,a4paper]{article}
\usepackage[left=2cm, right=2cm, top=2cm, bottom=2cm]{geometry}
\usepackage{fouriernc} 
\usepackage{pgfplots} 
\pgfplotsset{compat=1.18
}
\usepackage{float}
\usepackage{amsmath}
\usepackage{amsthm}
 \begin{document} 
  \begin{figure}[H]
  	\centering
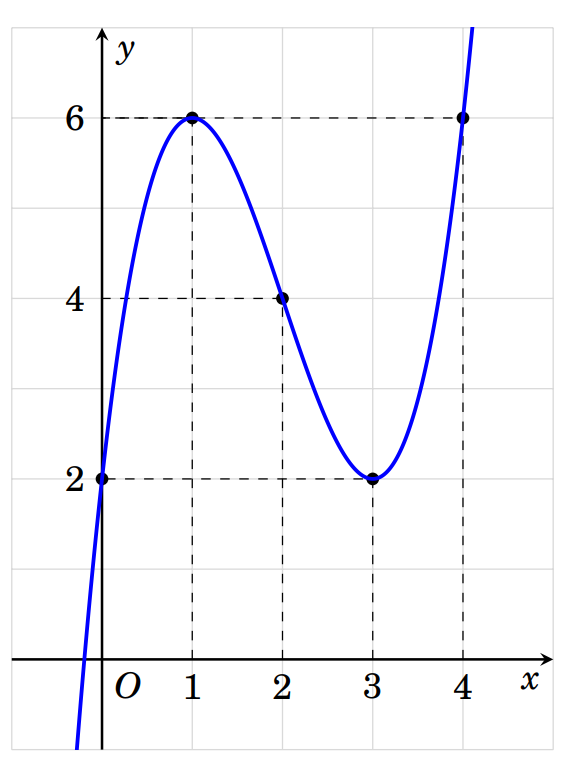
  	 \begin{tikzpicture}[>=stealth,scale =1,declare function={a=1;b=-6;c=9;d=2;
  			f(\x)=(a*\x*\x*\x+b*\x*\x+c*\x+d);
  			x1=(-b - sqrt(b^2 - 3* a* c))/(3*a); 
  			x2=(-b + sqrt(b^2 - 3* a* c))/(3*a); 
 y1=(2* b^3 - 9* a* b *c + 2* b^2 *sqrt(b^2 - 3 *a *c) - 
 6* a* c* sqrt(b^2 - 3* a *c) + 27* a^2 *d)/(27 *a^2);
 y2=(2* b^3 - 9* a* b *c - 2* b^2 *sqrt(b^2 - 3 *a *c) + 
 6* a* c* sqrt(b^2 - 3* a *c) + 27* a^2 *d)/(27 *a^2);
  x0=(x1+x2)/2;
  y0=(y1+y2)/2;
  xr=2*x2-x0;
  xl=2*x1-x0;
  xmin=xl-1;xmax=xr+1; 
   ymin=-1 ; ymax=max(y1,y2) + 1;
  }] 
  		\draw[gray!30] (xmin,ymin) grid (xmax,ymax); % grid 
  		\draw[->, thick] (xmin,0)--(xmax,0) node [below left]{$x$};
  		\draw[->,thick] (0,ymin)--(0,ymax) node [below right]{$y$}; %vẽ trục tung 
  		\foreach \X in {x1,x2,xr,xl,x0} {\draw[dashed] (\X,0) |- (0,{f(\X)}); } 
  		\node[below right] at (0, 0) {$O$}; 
  		\foreach \Y in {x1,x2,0,x0,xr} \fill (\Y,{f(\Y)}) circle(2pt); 
\foreach \p/\g [evaluate=\p] in {x1/-90,x2/-90,xr/-90,x0/-90}{%
\draw(\p,0)node[shift={(\g:.3)}]{$\pgfmathroundto{\p}\pgfmathresult$};}

\foreach \p/\g in {x1/180,x2/180,x0/180}{%
	\pgfmathparse{f(\p)}
	\draw(0,\pgfmathresult)node[shift={(\g:.3)}]{$\pgfmathroundto{\pgfmathresult}\pgfmathresult$};
}
  		\clip (xmin,ymin) rectangle (xmax,ymax);
  		 		\draw[smooth,samples=500,very thick,blue,domain=xmin:xmax] plot(\x,{f(\x)});
  		  	\end{tikzpicture} 
  	
  \end{figure}
 \end{document} 
```

![image.png](/image?hash=1de173ebd9ef8ce009110f9550e91333edec70c5c59a21d76118a2085c8af1b5)

In general, I want to make a code `\ifnum` like this
* If `min(y1,y2) > 0` or `min(y1,y2) =0` then `ymin=-1 ; ymax=max(y1,y2) + 1;`
* If `max(y1,y2) < 0` then `ymin = min(y1,y2) - 1`, ` ymax= 1;`
* If `y1*y2<0` then `ymin = min(y1,y2) - 1` and  `ymax=max(y1,y2) + 1;`

How can I write that code and input to my document?
Top Answer
Skillmon
The following defines two functions `ymincalc` and `ymaxcalc` which implement this logic (using a common auxiliary macro and a bit of `pgfmath`).

```
\documentclass[tikz, border=3.14]{standalone}

\usepackage{pgfplots}
\pgfplotsset{compat=1.18}

\makeatletter
\newcommand\yminmax@case[5]
  {%
    \begingroup
      \pgfmathsetmacro\ymin{min((#1),(#2))}%
      \pgfmathsetmacro\ymax{max((#1),(#2))}%
      \ifdim\ymin pt<\z@
        \ifdim\ymax pt<\z@
          \pgfmathparse{#4}%
        \else
          \pgfmathparse{#5}%
        \fi
      \else
        \pgfmathparse{#3}%
      \fi
      \pgfmathsmuggle\pgfmathresult
    \endgroup
  }

\pgfmathdeclarefunction{ymincalc}{2}
  {%
    \yminmax@case{#1}{#2}%
      {-1}
      {\ymin-1}
      {\ymin-1}%
  }
\pgfmathdeclarefunction{ymaxcalc}{2}
  {%
    \yminmax@case{#1}{#2}%
      {\ymax+1}
      {1}
      {\ymax+1}%
  }
\makeatletter

\begin{document}
\begin{tikzpicture}
  [%
    >=stealth, scale=1,
    declare function={a=1;b=-6;c=9;d=2;
      f(\x)=(a*\x*\x*\x+b*\x*\x+c*\x+d);
      x1=(-b - sqrt(b^2 - 3* a* c))/(3*a);
      x2=(-b + sqrt(b^2 - 3* a* c))/(3*a);
      y1=(2* b^3 - 9* a* b *c + 2* b^2 *sqrt(b^2 - 3 *a *c) -
          6* a* c* sqrt(b^2 - 3* a *c) + 27* a^2 *d)/(27 *a^2);
      y2=(2* b^3 - 9* a* b *c - 2* b^2 *sqrt(b^2 - 3 *a *c) +
          6* a* c* sqrt(b^2 - 3* a *c) + 27* a^2 *d)/(27 *a^2);
      x0=(x1+x2)/2;
      y0=(y1+y2)/2;
      xr=2*x2-x0;
      xl=2*x1-x0;
      xmin=xl-1;xmax=xr+1;
      ymin=ymincalc(y1,y2);
      ymax=ymaxcalc(y1,y2);
    }
  ]
  \draw[gray!30] (xmin,ymin) grid (xmax,ymax); % grid
  \draw[->, thick] (xmin,0)--(xmax,0) node [below left]{$x$};
  \draw[->,thick] (0,ymin)--(0,ymax) node [below right]{$y$}; %vẽ trục tung
  \foreach \X in {x1,x2,xr,xl,x0} {\draw[dashed] (\X,0) |- (0,{f(\X)}); }
  \node[below right] at (0, 0) {$O$};
  \foreach \Y in {x1,x2,0,x0,xr} \fill (\Y,{f(\Y)}) circle(2pt);
  \foreach \p/\g [evaluate=\p] in {x1/-90,x2/-90,xr/-90,x0/-90}
    \draw(\p,0)node[shift={(\g:.3)}]{$\pgfmathroundto{\p}\pgfmathresult$};

  \foreach \p/\g in {x1/180,x2/180,x0/180}
    {%
      \pgfmathparse{f(\p)}
      \draw(0,\pgfmathresult)
        node[shift={(\g:.3)}]{$\pgfmathroundto{\pgfmathresult}\pgfmathresult$};
    }
  \clip (xmin,ymin) rectangle (xmax,ymax);
  \draw[smooth,samples=500,very thick,blue,domain=xmin:xmax] plot(\x,{f(\x)});
\end{tikzpicture}
\end{document}
```

Enter question or answer id or url (and optionally further answer ids/urls from the same question) from

Separate each id/url with a space. No need to list your own answers; they will be imported automatically.