add tag
JohnPaul
I am using
```
\draw(\pgfmathresult,0)node[shift={(\g:.3)}]{$\fpeval{round(0,\pgfmathresult)}$};}
```
in this code

```
\documentclass[12pt,a4paper]{article}
\usepackage[left=2cm, right=2cm, top=2cm, bottom=2cm]{geometry}
\usepackage{fouriernc} 
\usepackage{pgfplots} 
\pgfplotsset{compat=1.18
}
\usepackage{float}
\usepackage{amsmath}
\usepackage{amsthm}
\begin{document} 
\begin{figure}[H]
		\centering
\begin{tikzpicture}[>=stealth,scale =1,declare function={a=1;b=3;c=6;d=1;k=1; 
f(\x)=(a*\x*\x+b*\x+c)/(d*\x+k); 
g(\x)=b/d - (a* k)/d^2 + (a *\x)/d; 
x1=(-a* k - sqrt(a*c*d^2 - a *b* d* k + a^2* k^2))/(a* d); 
x2=(-a*k + sqrt(a*c*d^2 - a*b* d*k + a^2* k^2))/(a*d);  
xmin=-7;xmax=5;ymin=-5;ymax=8;}] 
\draw[gray!30] (xmin,ymin) grid (xmax,ymax); 
\draw[->, thick] (xmin,0)--(xmax,0) node [below left]{$x$};
\draw[->,thick] (0,ymin)--(0,ymax) node [below right]{$y$};
\foreach \X in {x1,x2} {\draw[dashed] (\X,0) |- (0,{f(\X)}); } 
\node[below right] at (0, 0) {$O$}; 
\foreach \Y in {x1,x2,0} \fill (\Y,{f(\Y)}) circle(2pt); 

\foreach \p/\g in {0/180,x1/0,x2/180}{%
\pgfmathparse{(\p)}
\draw(\pgfmathresult,0)node[shift={(\g:.3)}]{$\fpeval{round(0,\pgfmathresult)}$};}
	
\foreach \p/\g in {0/180,x1/0,x2/180}{%
\pgfmathparse{f(\p)}
\draw(0,\pgfmathresult)node[shift={(\g:.3)}]{$\fpeval{round(\pgfmathresult,0)}$};
}
 
			
\clip (xmin,ymin) rectangle (xmax,ymax);
			
\draw[smooth,samples=500,very thick, blue,domain=xmin:10.9] plot(\x,{f(\x)});
				
\draw[smooth,samples=500,very thick, blue,domain=11.1:xmax] plot(\x,{f(\x)});	
			
\draw[smooth,samples=500,very thick, blue,domain=xmin:xmax]plot(\x,{g(\x)});
		
\draw[thick, blue] (-k/d,ymin) -- (-k/d,ymax);
\fill[red] (-k/d,{-((-b* d + 2 *a *k)/d^2)}) circle(2 pt); 
\end{tikzpicture} 
\end{figure}
	
\end{document}

```
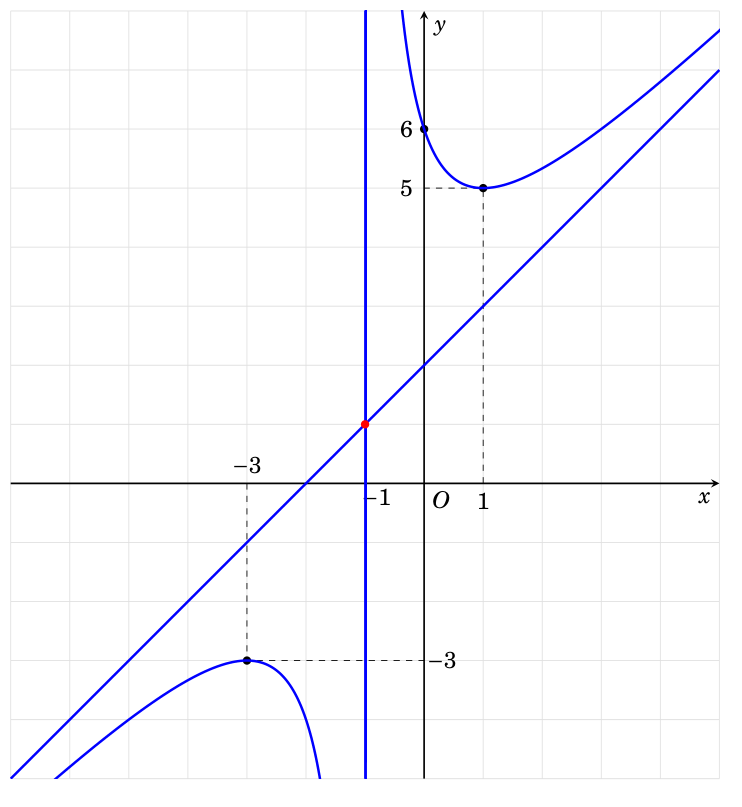
But I get incorrect result

![image.png](/image?hash=bed1daf83fc05882b42e32cba1b3257ab2d0f2e6de48f74b00c8db56e205e11b)

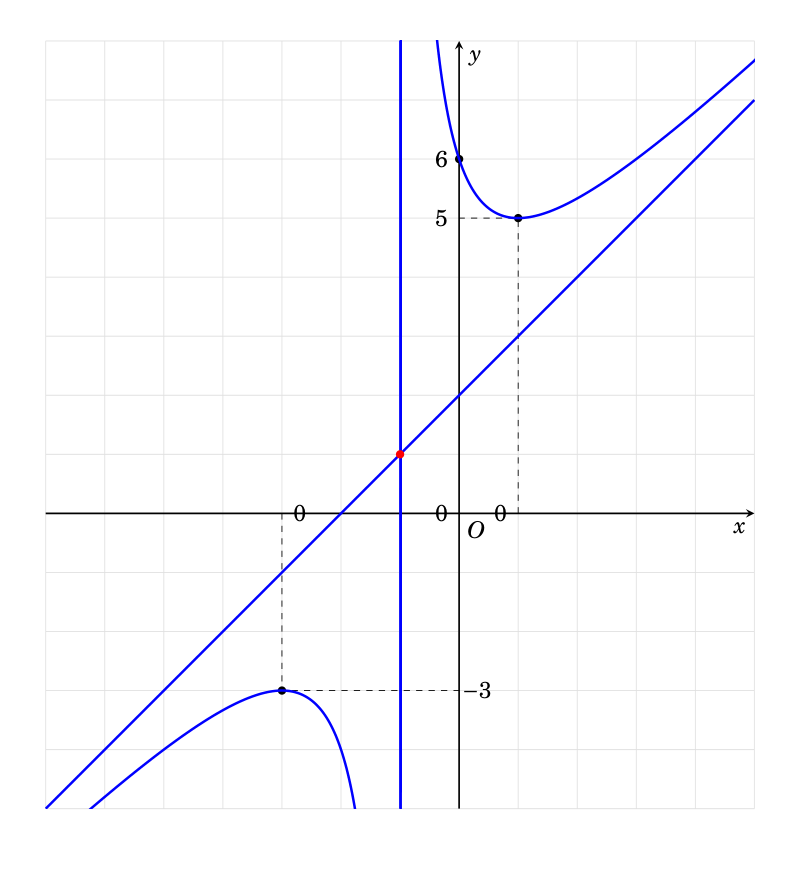
How can I get like this?

```
\documentclass[12pt,a4paper]{article}
\usepackage[left=2cm, right=2cm, top=2cm, bottom=2cm]{geometry}
\usepackage{fouriernc} 
\usepackage{pgfplots} 
\pgfplotsset{compat=1.18
}
\usepackage{float}
\usepackage{amsmath}
\usepackage{amsthm}
\begin{document} 
\begin{figure}[H]
		\centering
\begin{tikzpicture}[>=stealth,scale =1,declare function={a=1;b=3;c=6;d=1;k=1; 
f(\x)=(a*\x*\x+b*\x+c)/(d*\x+k); 
g(\x)=b/d - (a* k)/d^2 + (a *\x)/d; 
x1=(-a* k - sqrt(a*c*d^2 - a *b* d* k + a^2* k^2))/(a* d); 
x2=(-a*k + sqrt(a*c*d^2 - a*b* d*k + a^2* k^2))/(a*d);  
xmin=-7;xmax=5;ymin=-5;ymax=8;}] 
\draw[gray!30] (xmin,ymin) grid (xmax,ymax); 
\draw[->, thick] (xmin,0)--(xmax,0) node [below left]{$x$};
\draw[->,thick] (0,ymin)--(0,ymax) node [below right]{$y$};
\foreach \X in {x1,x2} {\draw[dashed] (\X,0) |- (0,{f(\X)}); } 
\node[below right] at (0, 0) {$O$}; 
\foreach \Y in {x1,x2,0} \fill (\Y,{f(\Y)}) circle(2pt); 

\foreach \p/\g in {-3/90,1/-90,-1/-50 }\draw(\p,0)node[shift={(\g:.3)},scale=1]{$\p$};  

\foreach \p/\g in {0/180,x1/0,x2/180}{%
\pgfmathparse{f(\p)}
\draw(0,\pgfmathresult)node[shift={(\g:.3)}]{$\fpeval{round(\pgfmathresult,0)}$};
}
 
\clip (xmin,ymin) rectangle (xmax,ymax);
			
\draw[smooth,samples=500,very thick, blue,domain=xmin:10.9] plot(\x,{f(\x)});
				
\draw[smooth,samples=500,very thick, blue,domain=11.1:xmax] plot(\x,{f(\x)});	
			
\draw[smooth,samples=500,very thick, blue,domain=xmin:xmax]plot(\x,{g(\x)});
		
\draw[thick, blue] (-k/d,ymin) -- (-k/d,ymax);
\fill[red] (-k/d,{-((-b* d + 2 *a *k)/d^2)}) circle(2 pt); 
\end{tikzpicture} 
\end{figure}
	
\end{document}

```

![image.png](/image?hash=39e434de92b27d0a48a7a58e6acc58f751b7a24f8e22b99b1759d0e48a922d05)
Top Answer
frougon
[samcarter's solution](https://topanswers.xyz/tex?q=7794#a7505) is quite fine. The purpose of this answer is to help you understand why your method didn't work. There are two problems:

1. As Ulrike [wrote](https://topanswers.xyz/transcript?room=7840&id=175570#c175570), you didn't use the correct order for the arguments of `xfp`'s `round()` function.

2. Since Ti*k*Z uses `pgfmath` to perform calculations, its operations (`\draw`, `\path`, `\fill`, etc.) are almost guaranteed to modify `\pgfmathresult` before the value you stored in it yourself had any chance to be used. In other words, hoping that a `\path`, `\draw`, etc. operation won't destroy a `\pgfmathresult` value you computed before the operation, is bound to fail.

The first error is trivial to correct: use `round(\myValue)` or `round(\myValue, 0)`. The second error is also easy to fix once you understand the underlying problem:

- you could do `\let\myValue\pgfmathresult` immediately after your `\pgfmathparse` calls and use `\myValue` instead of `\pgfmathresult` in the Ti*k*Z operations;

- or you can use a shortcut and ask `pgfmath` to store the result directly in the macro of your choice that Ti*k*Z code is *not* going to alter, instead of storing it in `\pgfmathresult`: `\pgfmathsetmacro{\myValue}{⟨pgfmath expression⟩}`.

Using the second solution, your two `\foreach` loops that place abscissas and ordinates can be reduced to the following:

```
\foreach \p/\g in {0/180,x1/0,x2/180} {
  \pgfmathsetmacro{\myX}{\p}
  \pgfmathsetmacro{\myY}{f(\p)}
  \path (\myX,0) node[anchor=north east] {$\fpeval{round(\myX)}$}
        (0,\myY) node[shift={(\g:.3)}] {$\fpeval{round(\myY)}$};
}
```

The same thing can be done without using `xfp`:

```
\foreach \p/\g in {0/180,x1/0,x2/180} {
  \pgfmathtruncatemacro{\myX}{round(\p)}
  \pgfmathtruncatemacro{\myY}{round(f(\p))}
  \path (\myX,0) node[anchor=north east] {$\myX$}
        (0,\myY) node[shift={(\g:.3)}] {$\myY$};
}
```

Note: your code misses the `\usepackage{xfp}` call; relying on “something” to do it for you is bad practice IMHO, as that “something” might drop the dependency on `xfp` at some point in the future, thereby quite legitimately breaking your document.

Here is the full example using the second way:

```
\documentclass[12pt,a4paper]{article}
\usepackage[left=2cm, right=2cm, top=2cm, bottom=2cm]{geometry}
\usepackage{fouriernc}
\usepackage{pgfplots}
\pgfplotsset{compat=1.18}
\usepackage{float}
\usepackage{amsmath}
\usepackage{amsthm}

\begin{document}
\begin{figure}[H]
		\centering
\begin{tikzpicture}[>=stealth,scale =1,declare function={a=1;b=3;c=6;d=1;k=1;
f(\x)=(a*\x*\x+b*\x+c)/(d*\x+k);
g(\x)=b/d - (a* k)/d^2 + (a *\x)/d;
x1=(-a* k - sqrt(a*c*d^2 - a *b* d* k + a^2* k^2))/(a* d);
x2=(-a*k + sqrt(a*c*d^2 - a*b* d*k + a^2* k^2))/(a*d);
xmin=-7;xmax=5;ymin=-5;ymax=8;}]
\draw[gray!30] (xmin,ymin) grid (xmax,ymax);
\draw[->, thick] (xmin,0)--(xmax,0) node [below left]{$x$};
\draw[->,thick] (0,ymin)--(0,ymax) node [below right]{$y$};
\foreach \X in {x1,x2} {\draw[dashed] (\X,0) |- (0,{f(\X)}); }
\node[below right] at (0, 0) {$O$};
\foreach \Y in {x1,x2,0} \fill (\Y,{f(\Y)}) circle(2pt);

\foreach \p/\g in {0/180,x1/0,x2/180} {
  \pgfmathtruncatemacro{\myX}{round(\p)}
  \pgfmathtruncatemacro{\myY}{round(f(\p))}
  \path (\myX,0) node[anchor=north east] {$\myX$}
        (0,\myY) node[shift={(\g:.3)}] {$\myY$};
}

\clip (xmin,ymin) rectangle (xmax,ymax);

\draw[smooth,samples=500,very thick, blue,domain=xmin:10.9] plot(\x,{f(\x)});

\draw[smooth,samples=500,very thick, blue,domain=11.1:xmax] plot(\x,{f(\x)});

\draw[smooth,samples=500,very thick, blue,domain=xmin:xmax]plot(\x,{g(\x)});

\draw[thick, blue] (-k/d,ymin) -- (-k/d,ymax);
\fill[red] (-k/d,{-((-b* d + 2 *a *k)/d^2)}) circle(2 pt);
\end{tikzpicture}
\end{figure}

\end{document}
```

![graph.png](/image?hash=9165b1f6e75fdc52c24db7c8b67ed1dedb9b88845e37d15787de333f2dfdc900)

# Label Placement

Orthogonal to what precedes : placement of labels along the *x* and *y* axes as asked in the question, can be done like so:

```
\usepackage{etoolbox}

(...)

\foreach \p/\xAnchor/\yAnchor in {0//east,x1/south/west,x2/north/east} {
  \ifdefempty{\xAnchor}{}{
    \pgfmathtruncatemacro{\myX}{round(\p)}
    \node[anchor=\xAnchor] at (\myX,0) {$\myX$};
  }

  \ifdefempty{\yAnchor}{}{
    \pgfmathtruncatemacro{\myY}{round(f(\p))}
    \node[anchor=\yAnchor] at (0,\myY) {$\myY$};
  }
}

\node[circle, anchor=140, inner sep=1pt] at (-1,0) {$-1$};
```

![graph.png](/image?hash=5699f6f3e5f9989c74921aa8f7ae8ccd73dcc5283579d1a97d2b5ca9de34bd42)
Answer #2
samcarter
You can use the `evaluate=...` option of `\foreach`:

```
\foreach \p/\g [evaluate=\p] in {0/180,x1/0,x2/180}{%
  \draw(\p,0)node[shift={(\g:.3)}]{\p};
}
```

This way the variable `\p` will actually hold the number and not `x1` etc. and you can use it to print the axis label.


```
\documentclass[12pt,a4paper]{article}
\usepackage[left=2cm, right=2cm, top=2cm, bottom=2cm]{geometry}
\usepackage{fouriernc} 
\usepackage{pgfplots} 
\pgfplotsset{compat=1.18
}
\usepackage{float}
\usepackage{amsmath}
\usepackage{amsthm}
\begin{document} 
\begin{figure}[H]
		\centering
\begin{tikzpicture}[>=stealth,scale =1,declare function={a=1;b=3;c=6;d=1;k=1; 
f(\x)=(a*\x*\x+b*\x+c)/(d*\x+k); 
g(\x)=b/d - (a* k)/d^2 + (a *\x)/d; 
x1=(-a* k - sqrt(a*c*d^2 - a *b* d* k + a^2* k^2))/(a* d); 
x2=(-a*k + sqrt(a*c*d^2 - a*b* d*k + a^2* k^2))/(a*d);  
xmin=-7;xmax=5;ymin=-5;ymax=8;}] 
\draw[gray!30] (xmin,ymin) grid (xmax,ymax); 
\draw[->, thick] (xmin,0)--(xmax,0) node [below left]{$x$};
\draw[->,thick] (0,ymin)--(0,ymax) node [below right]{$y$};
\foreach \X in {x1,x2} {\draw[dashed] (\X,0) |- (0,{f(\X)}); } 
\node[below right] at (0, 0) {$O$}; 
\foreach \Y in {x1,x2,0} \fill (\Y,{f(\Y)}) circle(2pt); 

\foreach \p/\g [evaluate=\p] in {0/180,x1/0,x2/180}{%
\draw(\p,0)node[shift={(\g:.3)}]{\pgfmathroundto{\p}\pgfmathresult};}
	
\foreach \p/\g in {0/180,x1/0,x2/180}{%
\pgfmathparse{f(\p)}
\draw(0,\pgfmathresult)node[shift={(\g:.3)}]{\pgfmathroundto{\pgfmathresult}\pgfmathresult};
}
 
			
\clip (xmin,ymin) rectangle (xmax,ymax);
			
\draw[smooth,samples=500,very thick, blue,domain=xmin:10.9] plot(\x,{f(\x)});
				
\draw[smooth,samples=500,very thick, blue,domain=11.1:xmax] plot(\x,{f(\x)});	
			
\draw[smooth,samples=500,very thick, blue,domain=xmin:xmax]plot(\x,{g(\x)});
		
\draw[thick, blue] (-k/d,ymin) -- (-k/d,ymax);
\fill[red] (-k/d,{-((-b* d + 2 *a *k)/d^2)}) circle(2 pt); 
\end{tikzpicture} 
\end{figure}
	
\end{document}
```

![Screenshot 2024-07-05 at 17.59.43.png](/image?hash=de9eb9faf56cc681d7415961d4a6a8e0e13062820fb266ea2e9f742955a469da)

Enter question or answer id or url (and optionally further answer ids/urls from the same question) from

Separate each id/url with a space. No need to list your own answers; they will be imported automatically.