Laurenso

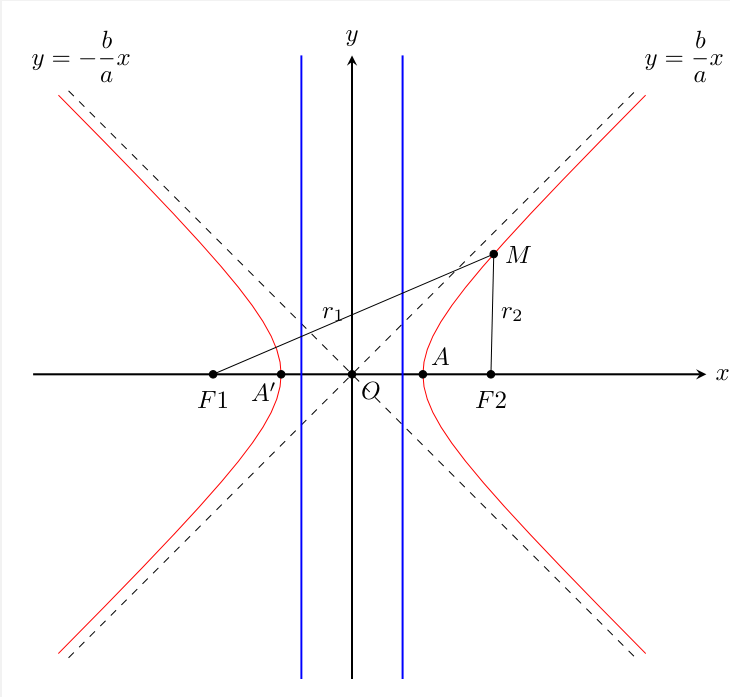
I am trying to draw this figure
I tried
```
\documentclass[tikz,border=3mm]{standalone}
\usepackage{pgfplots}
\pgfplotsset{compat=1.18}
\usepackage{calc}
\begin{document}
\begin{tikzpicture}[>=stealth,declare function={mye=1.5;a=1.5;b=a*sqrt((mye)^2-1);c=sqrt(a^2+b^2);xmin=-a-2;xmax=a+2;}]
\path
(-c,0) coordinate (F1)
(c,0) coordinate (F2)
(0,0) coordinate (O)
(-a,0) coordinate (A')
(a,0) coordinate (A)
({a*sec(60)},{b*tan(60)}) coordinate (M)
;
\draw[thick, ->] (xmin,0) -- (xmax,0) node[right]{$x$};
\draw[thick, ->] (0,b/a*xmin) -- (0,b/a*xmax) node[above]{$y$};
\draw[dashed, domain=xmin:xmax] plot(\x,{b/a*\x});
\draw[dashed, domain=xmin:xmax] plot(\x,{-b/a*\x});
\draw[red,smooth,samples=100, domain=a:xmax] plot(\x,{b/a*sqrt(\x^2-a^2)});
\draw[red,smooth,samples=400, domain=a:xmax] plot(\x,{-b/a*sqrt(\x^2-a^2)});
\draw[red,smooth,samples=400, domain=a:xmax] plot(\x,{-b/a*sqrt(\x^2-a^2)});
\draw[red,smooth,samples=400, domain=xmin:-a] plot(\x,{-b/a*sqrt(\x^2-a^2)});
\draw[thick, blue] (a/mye,b/a*xmin) -- (a/mye,b/a*xmax);
\draw[thick, blue] (-a/mye,b/a*xmin) -- (-a/mye,b/a*xmax);
\foreach \p in {A,A',O,F1,F2,M}
\draw[fill=black] (\p) circle (1.5pt);
\foreach \p/\g in {A/45,A'/-135,O/-40,F1/-90,F2/-90,M/0}
\path (\p)+(\g:3.5mm) node{$\p$};
\draw (F1) -- (M) node[midway,left]{$ r_1 $};
\draw (F2) -- (M) node[midway, right]{$ r_2 $};
\end{tikzpicture}
\end{document}
```
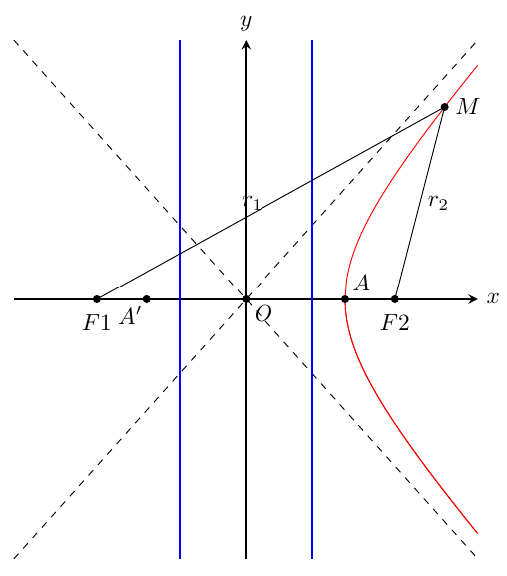
I have a problem at
```
\draw[red,smooth,samples=400, domain=xmin:-a] plot(\x,{-b/a*sqrt(\x^2-a^2)});
```
How can I repair it?