Raaja

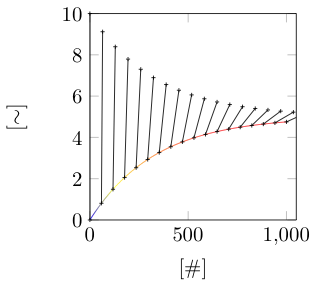
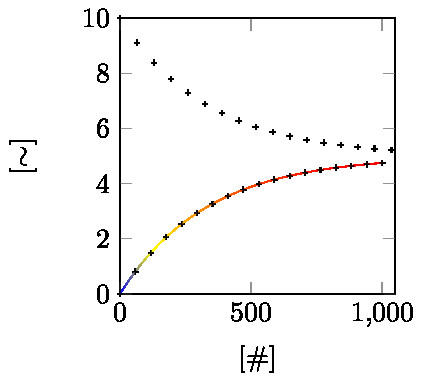
I have two curves sampled as shown below:
```
%&lualatex
% !TeX TXS-program:compile = txs:///lualatex/[--shell-escape]
\documentclass[convert={density=600,outext=.tiff}]{standalone}
\usepackage{tikz, pgfplots}
\begin{document}
\begin{tikzpicture}
\begin{axis}[width=2in, height=2in,xmin = 0, xmax = 1050, ymin = 0, ymax = 10, ylabel = {[$\sim$]}, xlabel = {[\#]},legend style={at={(1,0)}, anchor=south east, font=\tiny, draw=none, fill=none}] ;
\addplot [mesh, domain = 0:1000,samples=300] {5*(1-exp(-0.003*x))};
\addplot [black, domain=0:1000, samples = 18, only marks, mark size = 1pt, mark = +] {5*(1-exp(-0.003*x))};
\addplot [black, domain=0:1100, samples = 18, only marks, mark size = 1pt, mark = +] {10 - 5*(1-exp(-0.003*x))};
\end{axis}
\end{tikzpicture}
\end{document}
```
I want to draw lines between the sampled data-points shown below:
But not sure how to achieve it.
Top Answer
user 3.14159

Another way is to use `nodes near coords`.
```
\documentclass[tikz,convert={density=600,outext=.tiff}]{standalone}
\usepackage{pgfplots}
\pgfplotsset{compat=1.16}
\pgfplotsset{% https://tex.stackexchange.com/a/75811/121799
name nodes near coords/.style={nodes near coords={},
every node near coord/.append style={anchor=center,coordinate,
name=#1-\coordindex,/utils/exec=\typeout{#1-\coordindex},
alias=#1-last,
},
},
name nodes near coords/.default=coordnode
}
\begin{document}
\begin{tikzpicture}
\begin{axis}[width=2in, height=2in,xmin = 0, xmax = 1050, ymin = 0, ymax = 10,
ylabel = {[$\sim$]}, xlabel = {[\#]},legend style={at={(1,0)}, anchor=south
east, font=\tiny, draw=none, fill=none},declare function={f(\x)=5*(1-exp(-0.003*\x));}] ;
\addplot [mesh, domain = 0:1000,samples=300] {f(x)};
\addplot [black, domain=0:1000, samples = 18, only marks, mark size = 1pt, mark=
+,name nodes near coords=T] {f(x)};
\addplot [black, domain=0:1100, samples = 18, only marks, mark size = 1pt, mark
= +,name nodes near coords=B] {10 -f(x)};
\end{axis}
\foreach \X in {0,...,16}
{\draw (B-\X) -- (T-\X);}
\end{tikzpicture}
\end{document}
```
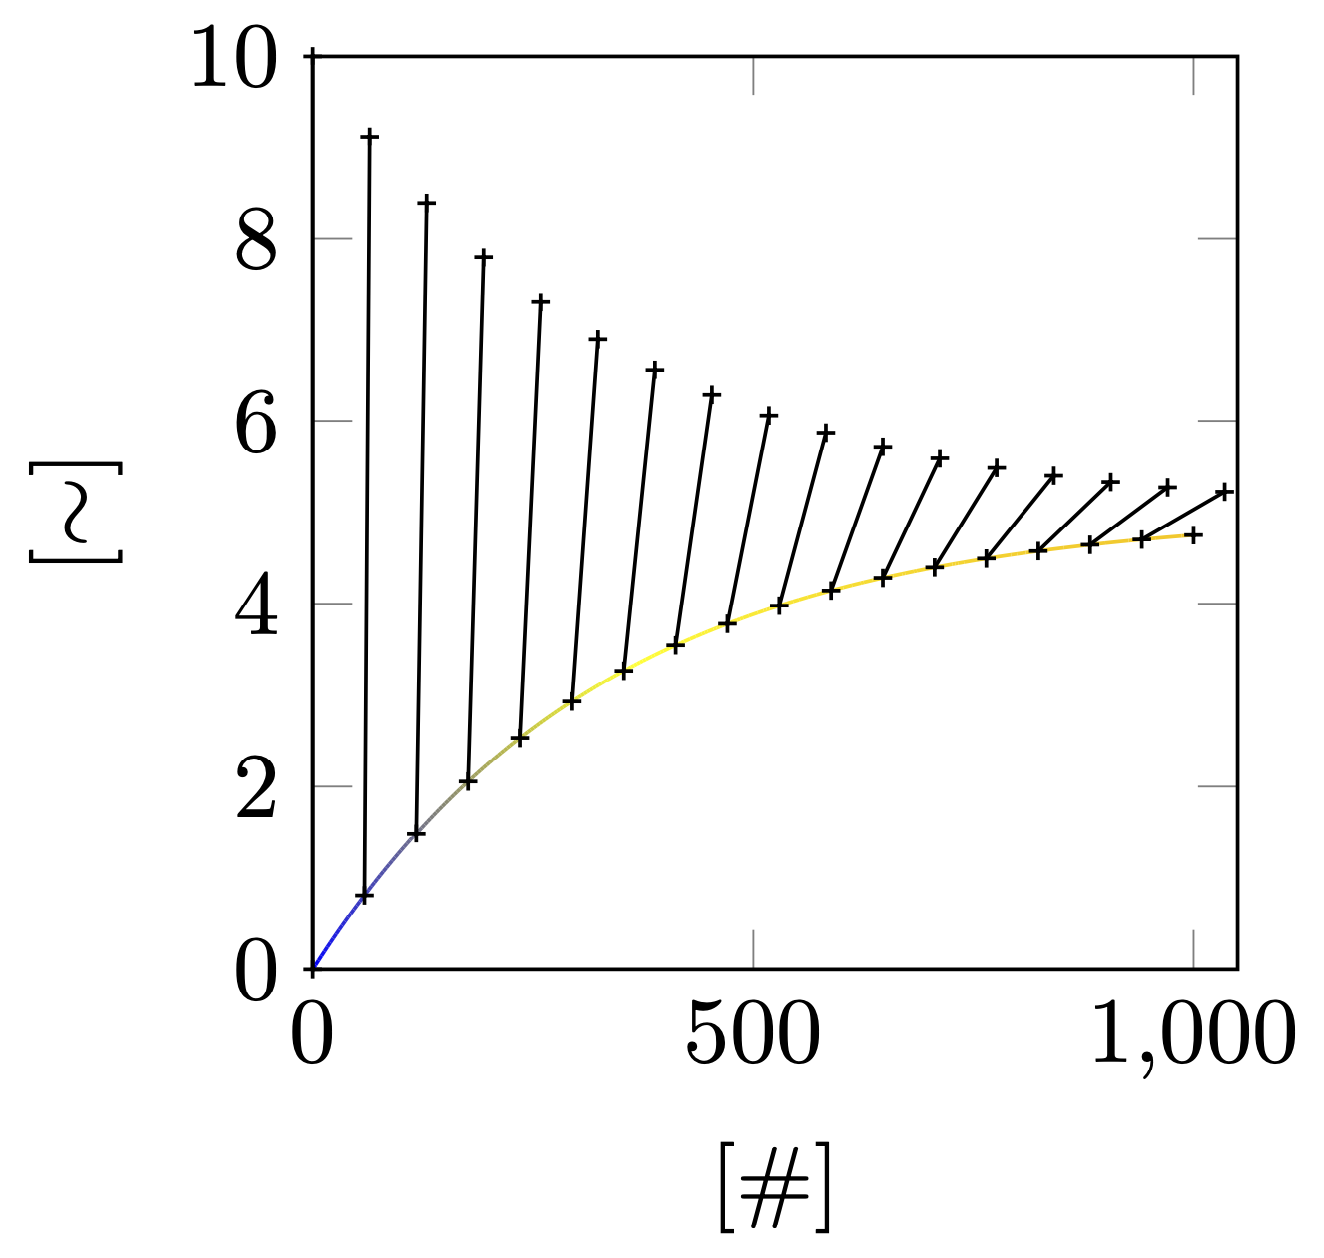
A potential problem is that the last mark on the upper plot gets clipped away, and thus not connected.
Answer #2
samcarter

Not very elegant, but worst case you could add the lines manually:
```
\documentclass{standalone}
\usepackage{tikz, pgfplots}
\tikzset{
declare function={
f(\x)=(5*(1-exp(-0.003*\x))));
}
}
\begin{document}
\begin{tikzpicture}
\begin{axis}[width=2in, height=2in,xmin = 0, xmax = 1050, ymin = 0, ymax = 10, ylabel = {[$\sim$]}, xlabel = {[\#]},legend style={at={(1,0)}, anchor=south east, font=\tiny, draw=none, fill=none}] ;
\addplot [mesh, domain = 0:1000,samples=300] {f(x)};
\addplot [black, domain=0:1000, samples = 18, only marks, mark size = 1pt, mark = +] {f(x)};
\addplot [black, domain=0:1100, samples = 18, only marks, mark size = 1pt, mark = +] {10 - f(x)};
\foreach \i in {0,...,18}{
\addplot[mark=none] coordinates {(\i*1100/17,{10-f(x)}) (\i*1000/17,{f(x)})};
}
\end{axis}
\end{tikzpicture}
\end{document}
```