Laurenso

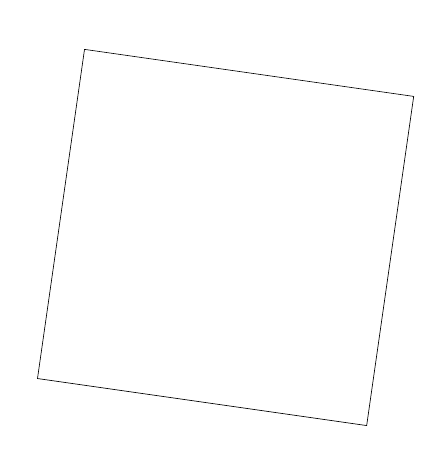
I have square `ABCD`
```
\documentclass[12pt,a4paper]{article}
\usepackage[left=2cm, right=2cm, top=2cm, bottom=2cm]{geometry}
\usepackage{tikz}
\begin{document}
\begin{tikzpicture}
\path
(-2,-5) coordinate (A)
(5,-6) coordinate (B)
(6,1) coordinate (C)
(-1,2) coordinate (D)
;
\draw (A) -- (B) -- (C) -- (D) -- cycle;
;
\end{tikzpicture}
\end{document}
```
This square lies on this graph `-6.85793 - 12.4258 x + 2.29471 x^2 + 5.56691 x^3 - 0.986209 x^4 - 0.523781 x^5 + 0.1556 x^6 - 0.0111143 x^7` . I tried
```
\documentclass[12pt,a4paper]{article}
\usepackage[left=2cm, right=2cm, top=2cm, bottom=2cm]{geometry}
\usepackage{tikz}
\begin{document}
\begin{tikzpicture}
\path
(-2,-5) coordinate (A)
(5,-6) coordinate (B)
(6,1) coordinate (C)
(-1,2) coordinate (D)
;
\draw (A) -- (B) -- (C) -- (D) -- cycle;
;
\draw[red,thick]
plot[domain=(-10):(10),samples=101,smooth] (\x,{-6.85793 - 12.4258*\x + 2.29471*\x^2 + 5.56691*\x^3 - 0.986209*\x^4 -
0.523781*\x^5 + 0.1556*\x^6 - 0.0111143*\x^7})
;
\end{tikzpicture}
\end{document}
```
I get Dimention too large. How can I avoid Dimention too large?
Top Answer
Skillmon

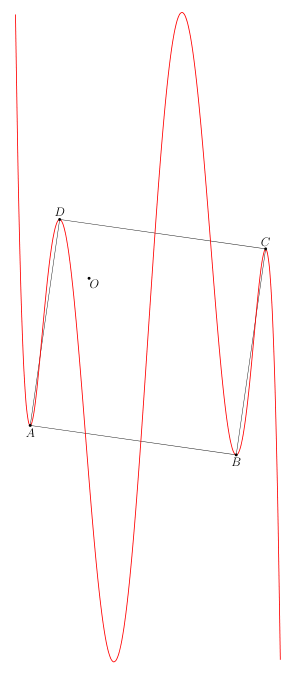
If a step inside the calculation is the issue for the "dimension too large" error and not the final result of your calculation you can use the `pgfmath-xfp` package to do the calculation with the more precise `l3fp` engine instead of Ti*k*Z's math engine, and only use the result in Ti*k*Z.
Another approach could be to do what `pgfplot` does internally, namely use Ti*k*Z's own FPU for the calculation, but since I'm the author of `pgfmath-xfp` the following shows the usage of that instead.
```
\documentclass[12pt,a4paper]{article}
\usepackage[left=2cm, right=2cm, top=2cm, bottom=2cm]{geometry}
\usepackage{tikz}
\usepackage{pgfmath-xfp}
\begin{document}
\begin{tikzpicture}[c/.style={circle,fill,inner sep=1pt}]
\path
(0,0) coordinate (O)
(-2,-5) coordinate (A)
(5,-6) coordinate (B)
(6,1) coordinate (C)
(-1,2) coordinate (D)
;
\draw
(A) -- (B) -- (C) -- (D) -- cycle
;
\pgfmxfpdeclarefunction{myplot}{1}
{
-6.85793 - 12.4258*(#1) + 2.29471*(#1)^2 + 5.56691*(#1)^3 - 0.986209*(#1)^4 -
0.523781*(#1)^5 + 0.1556*(#1)^6 - 0.0111143*(#1)^7
}
\draw[red,thick]
plot[domain=-2.5:6.5,samples=101,smooth]
(\x,{myplot(\x)})
;
\path
foreach \p/\g in {A/-90,B/-90,C/90,D/90,O/-45}
{(\p)node[c]{}+(\g:2.5mm) node{$\p$}}
;
\end{tikzpicture}
\end{document}
```
Answer #2
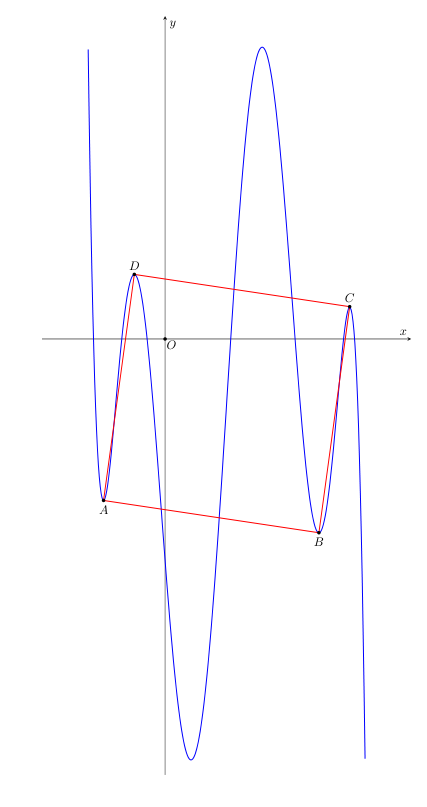
Laurenso
I tried
```
\begin{figure}[H]
\centering
\begin{tikzpicture}[c/.style={circle,fill,inner sep=1pt}]
\begin{axis}
[width=12cm,
height=23cm,
xmin=-4, xmax=8,
ymin=-13.5, ymax=10,
samples=101,
axis lines=center,
xlabel=$x$,
ylabel=$y$,
ytick=\empty,
xtick=\empty]
\addplot[domain=-2.5:6.5,samples=300,blue,thick]{-6.85793 - 12.4258* x + 2.29471*x^2 + 5.56691*x^3 - 0.986209*x^4 - 0.523781*x^5 + 0.1556*x^6 - 0.0111143*x^7};
\path
(0,0) coordinate (O)
(-2,-5) coordinate (A)
(5,-6) coordinate (B)
(6,1) coordinate (C)
(-1,2) coordinate (D)
($(A)!.5!(C)$) coordinate (I)
;
\draw[red, thick] (A) -- (B) -- (C) -- (D) -- cycle;
\path foreach \p/\g in {A/-90,B/-90,C/90,D/90,O/-45}
{(\p)node[c]{}+(\g:2.5mm) node{$\p$}};
\end{axis}
\end{tikzpicture}
\end{figure}
```
Answer #3
samcarter

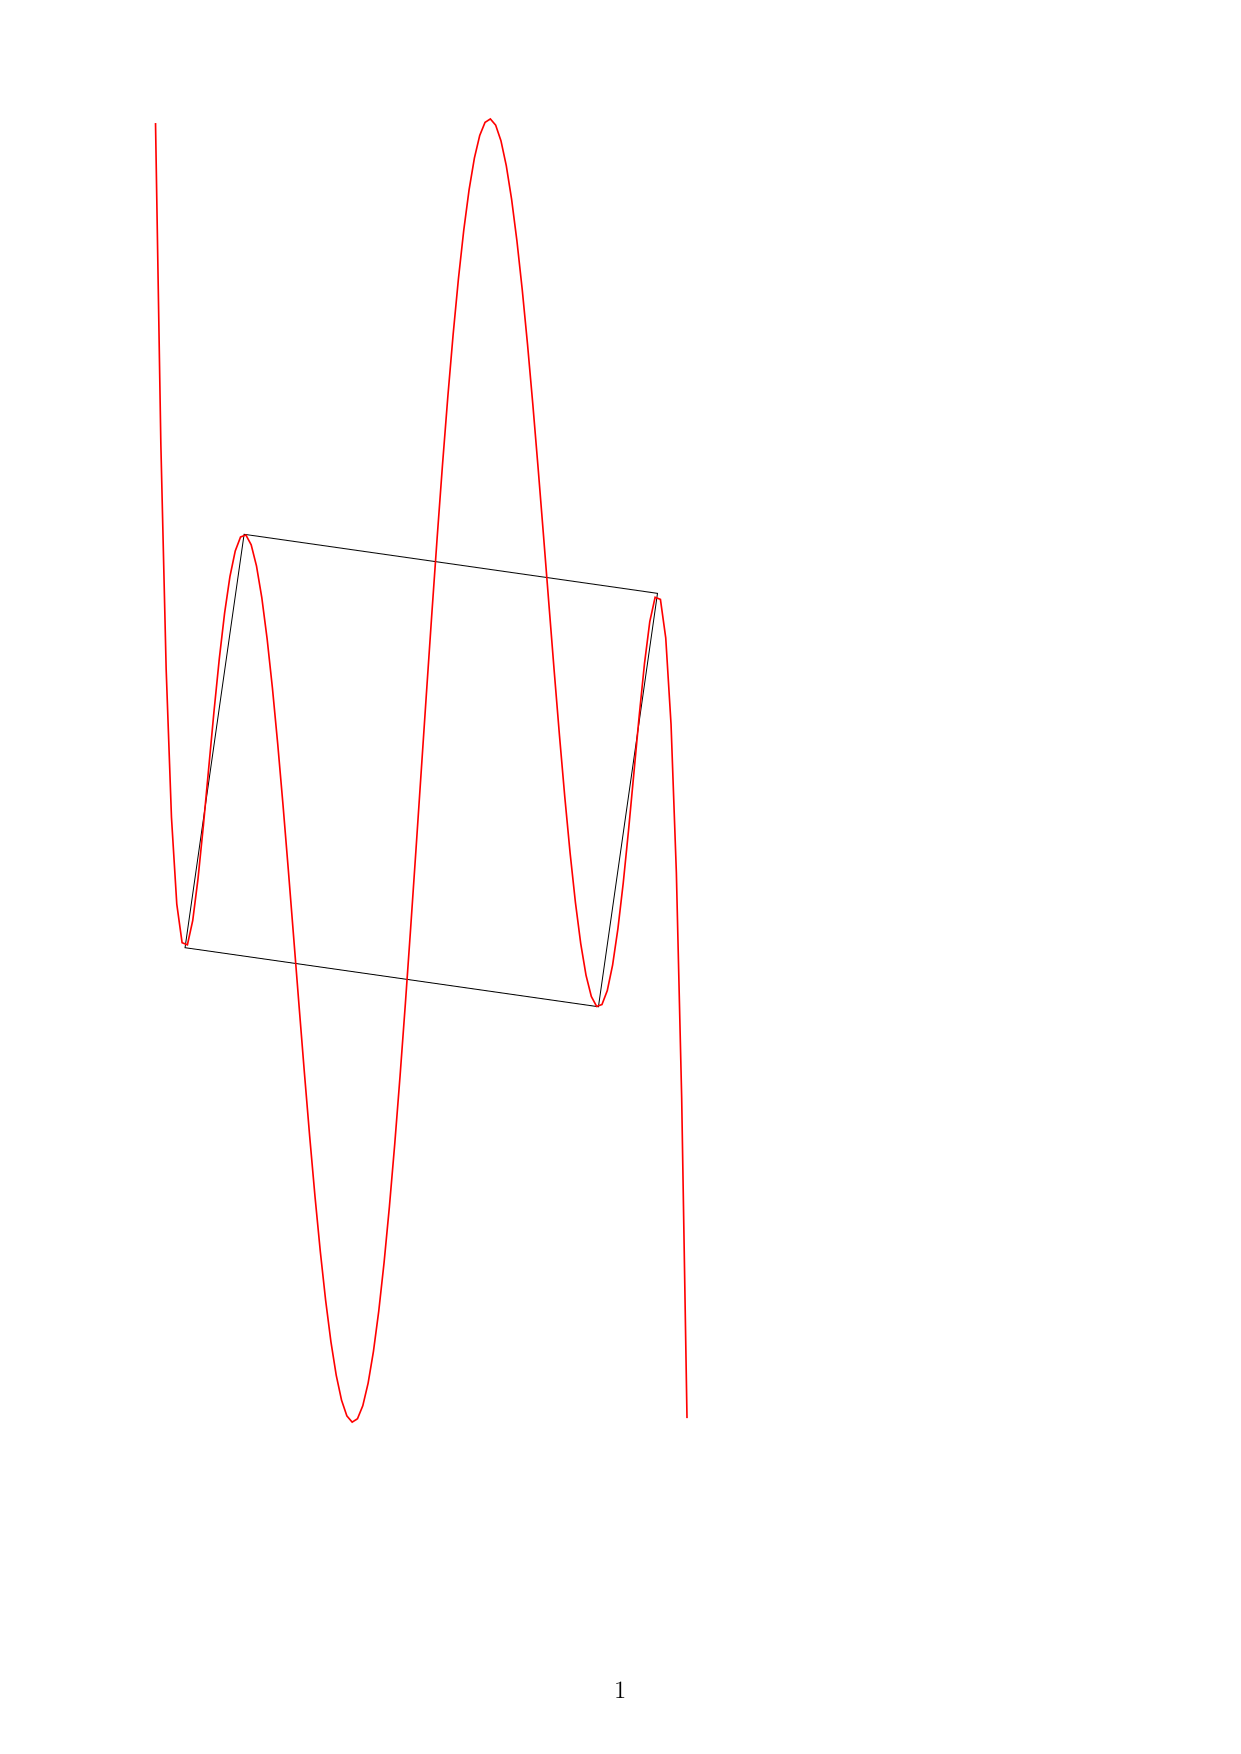
- The "dimension too large" error will automatically vanish if you choose a more suitable domain which does not result in a 3 km tall graph
- to improve the numerical accuracy of the calculations, you could use the trick from https://topanswers.xyz/tex?q=925#a1089 and let latex do floating point calculations instead of relying on TikZ's math capabilities (with a current latex distribution, you no longer have to load the extra packages):
```
\documentclass[12pt,a4paper]{article}
\usepackage[left=2cm, right=2cm, top=2cm, bottom=2cm]{geometry}
\usepackage{tikz}
\begin{document}
\begin{tikzpicture}
\path
(-2,-5) coordinate (A)
(5,-6) coordinate (B)
(6,1) coordinate (C)
(-1,2) coordinate (D)
;
\draw (A) -- (B) -- (C) -- (D) -- cycle;
\draw[red,thick]
plot[domain=(-2.5):(6.5),samples=101] (\x,{\fpeval{-6.85793 - 12.4258*\x + 2.29471*\x*\x + 5.56691*\x*\x*\x - 0.986209*\x*\x*\x*\x -
0.523781*\x*\x*\x*\x*\x + 0.1556*\x*\x*\x*\x*\x*\x - 0.0111143*\x*\x*\x*\x*\x*\x*\x}})
;
\end{tikzpicture}
\end{document}
```
Alternatively, you could use the pgf `fpu` library:
```
\documentclass[12pt,a4paper]{article}
\usepackage[left=2cm, right=2cm, top=2cm, bottom=2cm]{geometry}
\usepackage{tikz}
\usepgflibrary{fpu}
\pgfkeys{/pgf/fpu,/pgf/fpu/output format=fixed}
\begin{document}
\begin{tikzpicture}
\path
(-2,-5) coordinate (A)
(5,-6) coordinate (B)
(6,1) coordinate (C)
(-1,2) coordinate (D)
;
\draw (A) -- (B) -- (C) -- (D) -- cycle;
\draw[red,thick]
plot[domain=(-2.5):(6.5),samples=101] (\x,{
(((((
- 0.0111143*\x)
+ 0.1556)*\x
- 0.523781)*\x
- 0.986209)*\x
+ 5.56691)*\x
+ 2.29471)*\x
- 12.4258)*\x
-6.85793
})
;
\end{tikzpicture}
\end{document}
```
