Laurenso

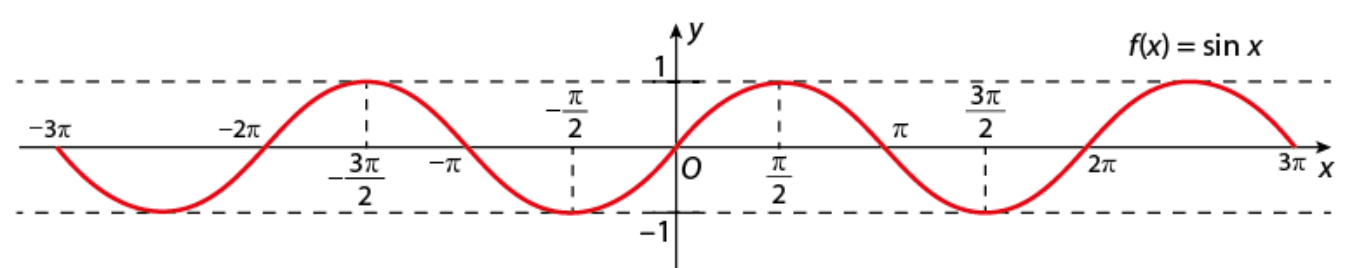
I am trying to draw the graph of sin interval `[-3pi, 3pi]` like this
I tried
```
\documentclass{standalone}
\usepackage {pgfplots}
\pgfplotsset {compat=1.17}
\begin{document}
\begin{tikzpicture}
\begin{axis}
[
domain=-10:10,
xmin=-10, xmax=10,
ymin=-1.5, ymax=1.5,
samples=101,
axis lines=center,
ytick=\empty,
xlabel=$x$,
ylabel=$y$,
xtick={-9.42478, -6.28319,-4.71239,-3.14,-1.5708,0,1.5708,3.14159,4.71239,6.28319,9.42478},
xticklabels={$-3\pi$,$-2\pi$,$-\frac{3\pi}{2}$,$-\pi$,$-\frac{\pi}{2}$,$0$,$\frac{\pi}{2}$,$\pi$, $\frac{3\pi}{2}$, $2\pi$, $3\pi$ }]
\addplot[domain=-3*pi:3*pi,samples=100,red,thick]{sin(deg(x))};
\addplot[domain=-3*pi:3*pi,samples=100,blue,dashed]{-1};
\addplot[domain=-3*pi:3*pi,samples=100,blue,dashed]{1};
\end{axis}
\end{tikzpicture}
\end{document}
```
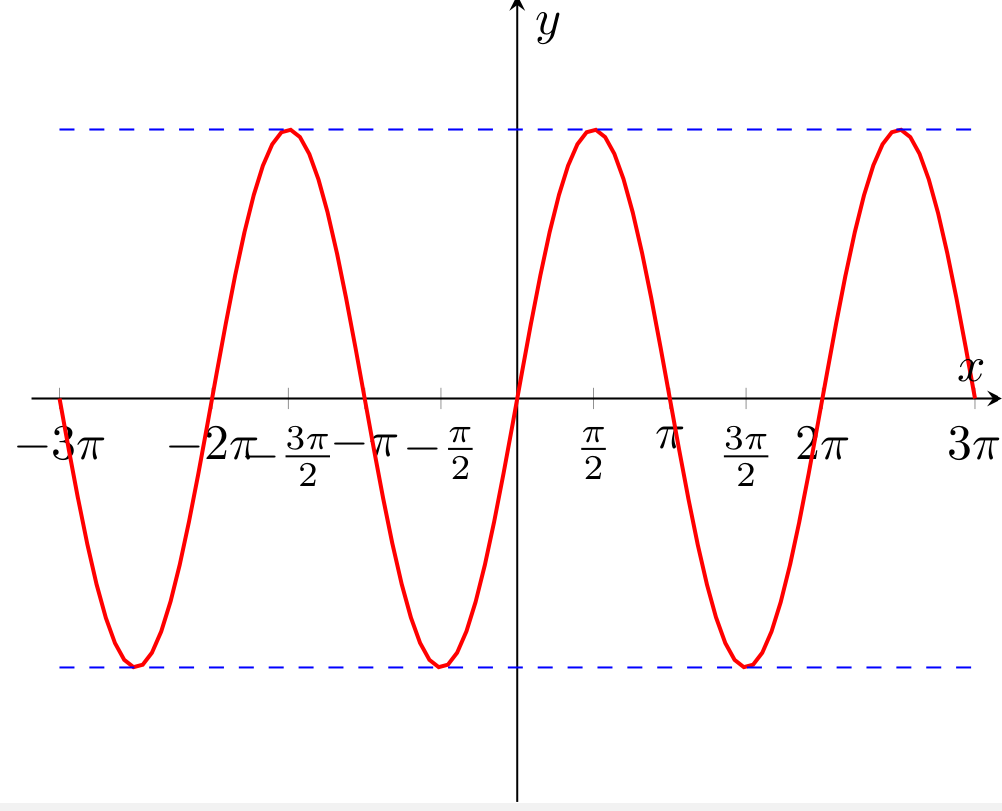
I get