tikz add tag
CarLaTeX
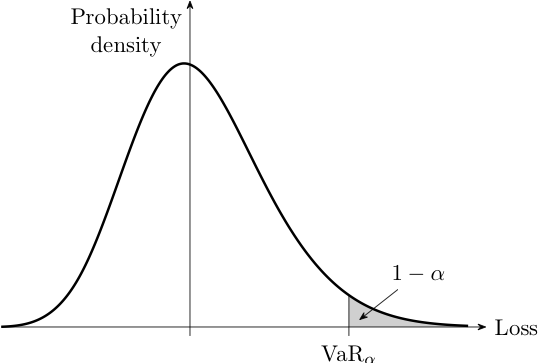
As you can see, the VaR tick is longer than the one under the y axis.

How can I have them equals without manually drawing the tick under the y axis? 

P.S. = The skewed Normal distribution is from https://tex.stackexchange.com/a/461839/101651.

~~~
\documentclass[11pt]{standalone}
% tikz
\usepackage{tikz}
\usepackage{pgfplots}
\pgfplotsset{compat=newest}
\usetikzlibrary{arrows.meta}
\usetikzlibrary{positioning}
\usetikzlibrary{backgrounds}
	\pgfplotsset{
		assi/.style={
			axis lines=middle,
			axis line style={-Stealth},
			ticks=none,
			samples=300,
			clip=false,
			},
	}
\usetikzlibrary{math}
\tikzmath{%
  function h1(\x, \lx) { return (9*\lx + 3*((\lx)^2) + ((\lx)^3)/3 + 9); };
  function h2(\x, \lx) { return (3*\lx - ((\lx)^3)/3 + 4); };
  function h3(\x, \lx) { return (9*\lx - 3*((\lx)^2) + ((\lx)^3)/3 + 7); };
  function skewnorm(\x, \l) {
    \x = (\l < 0) ? -\x : \x;
    \l = abs(\l);
    \e = exp(-(\x^2)/2);
    return (\l == 0) ? 1 / sqrt(2 * pi) * \e: (
      (\x < -3/\l) ? 0 : (
      (\x < -1/\l) ? \e / (8 * sqrt(2 * pi)) * h1(\x, \x*\l) : (
      (\x <  1/\l) ? \e / (4 * sqrt(2 * pi)) * h2(\x, \x*\l) : (
      (\x <  3/\l) ? \e / (8 * sqrt(2 * pi)) * h3(\x, \x*\l) : (
      sqrt(2/pi) * \e)))));
  };
}
\begin{document}
\begin{tikzpicture}
\begin{axis}[
	assi,
	enlarge x limits={value=.04,upper},
	enlarge y limits={value=.02,lower},
	ymax=.73,
	xscale=1.2,
	xlabel = {Loss},
	x label style={at=(current axis.right of origin),
		anchor=west},
	ylabel = {Probability\\ density},
	y label style={%at=(current axis.above origin),
		anchor=north east, align=center, %inner sep=0pt
		},
	]
	\pgfmathsetmacro{\limiteinf}{-1.9}
	\pgfmathsetmacro{\limitesup}{2.8}
	\pgfmathsetmacro{\VaRx}{1.6}
	\pgfmathsetmacro{\VaR}{skewnorm(\VaRx+.6,2)}
	\begin{scope}[on background layer]
		\addplot[fill=gray!30, draw=none, domain=\VaRx:\limitesup] 
			{skewnorm((x+.6), 2)} \closedcycle;
	\end{scope}
	\addplot[very thick, domain=\limiteinf:\limitesup] {skewnorm((x+.6), 2)};
	\draw (axis cs:\VaRx,0) -- (axis cs:\VaRx,\VaR);
	\draw (axis cs:\VaRx,0) -- (axis cs:\VaRx,-.02) 
		node[below=4pt, inner sep=0pt] {$\mathrm{VaR}_\alpha$};
	\node (unomenoalfa) at (axis cs:2.3,0.12) {$1-\alpha$}; 
	\draw[-Stealth] (unomenoalfa) -- (axis cs:1.7,0.015);
\end{axis}
\end{tikzpicture}
\end{document}
~~~
Top Answer
samcarter
Not sure if this counts as "not drawing it manually", but at the moment, the line below the origin comes from `enlarge y limits={value=.02,lower}`. You could  instead set `ymin` to the same value as your tick at VaR.

The reason `enlarge y limits={value=.02,lower}` did not work as expected is that this seems to be a relative value. From the `pgfplots` docu:

> `\pgfplotsset{enlarge x limits={value=0.2,upper}}` will enlarge (only) the upper axis limit by 20% of the axis range.


```
\documentclass[11pt]{standalone}
% tikz
\usepackage{tikz}
\usepackage{pgfplots}
\pgfplotsset{compat=newest}
\usetikzlibrary{arrows.meta}
\usetikzlibrary{positioning}
\usetikzlibrary{backgrounds}
	\pgfplotsset{
		assi/.style={
			axis lines=middle,
			axis line style={-Stealth},
			ticks=none,
			samples=300,
			clip=false,
			},
	}
\usetikzlibrary{math}
\tikzmath{%
  function h1(\x, \lx) { return (9*\lx + 3*((\lx)^2) + ((\lx)^3)/3 + 9); };
  function h2(\x, \lx) { return (3*\lx - ((\lx)^3)/3 + 4); };
  function h3(\x, \lx) { return (9*\lx - 3*((\lx)^2) + ((\lx)^3)/3 + 7); };
  function skewnorm(\x, \l) {
    \x = (\l < 0) ? -\x : \x;
    \l = abs(\l);
    \e = exp(-(\x^2)/2);
    return (\l == 0) ? 1 / sqrt(2 * pi) * \e: (
      (\x < -3/\l) ? 0 : (
      (\x < -1/\l) ? \e / (8 * sqrt(2 * pi)) * h1(\x, \x*\l) : (
      (\x <  1/\l) ? \e / (4 * sqrt(2 * pi)) * h2(\x, \x*\l) : (
      (\x <  3/\l) ? \e / (8 * sqrt(2 * pi)) * h3(\x, \x*\l) : (
      sqrt(2/pi) * \e)))));
  };
}
\begin{document}
\begin{tikzpicture}
\begin{axis}[
	assi,
	enlarge x limits={value=.04,upper},
%	enlarge y limits={value=.03,lower},
	ymin=-0.02,
	ymax=.73,
	xscale=1.2,
	xlabel = {Loss},
	x label style={at=(current axis.right of origin),
		anchor=west},
	ylabel = {Probability\\ density},
	y label style={%at=(current axis.above origin),
		anchor=north east, align=center, %inner sep=0pt
		},
	]
	\pgfmathsetmacro{\limiteinf}{-1.9}
	\pgfmathsetmacro{\limitesup}{2.8}
	\pgfmathsetmacro{\VaRx}{1.6}
	\pgfmathsetmacro{\VaR}{skewnorm(\VaRx+.6,2)}
	\begin{scope}[on background layer]
		\addplot[fill=gray!30, draw=none, domain=\VaRx:\limitesup] 
			{skewnorm((x+.6), 2)} \closedcycle;
	\end{scope}
	\addplot[very thick, domain=\limiteinf:\limitesup] {skewnorm((x+.6), 2)};
	\draw (axis cs:\VaRx,0) -- (axis cs:\VaRx,\VaR);
	\draw (axis cs:\VaRx,0) -- (axis cs:\VaRx,-.02) 
		node[below=4pt, inner sep=0pt] {$\mathrm{VaR}_\alpha$};
	\node (unomenoalfa) at (axis cs:2.3,0.12) {$1-\alpha$}; 
	\draw[-Stealth] (unomenoalfa) -- (axis cs:1.7,0.015);
\end{axis}
\end{tikzpicture}
\end{document}
```
![document5.png](/image?hash=3f7c1ca7f7964f7c5afe96a77f5369aa516ac300f88a8fd1987fdd494a626876)

Enter question or answer id or url (and optionally further answer ids/urls from the same question) from

Separate each id/url with a space. No need to list your own answers; they will be imported automatically.