Laurenso

This is my code
```
\documentclass{article}
\usepackage{tabularray}
\UseTblrLibrary{booktabs}
\usepackage{enumitem}
\usepackage{amsmath}
\usepackage{tikz,tkz-tab}
\usepackage[paperwidth=20.5cm, paperheight=29cm, left=1.7cm,right=1.7cm,top=1.8cm,bottom=1.7cm]{geometry}
\begin{document}
\begin{booktabs}{
colspec = X[c]X[c],vlines,hlines
}
$ a>1 $ & $ 0<a<1 $\\
The function is an increasing function & The function is an decreasing function \\
$ \displaystyle\lim _{x \rightarrow 0^{+}} \log _a x=-\infty$, $\displaystyle\lim _{x \rightarrow+\infty} \log _a x=+\infty $ & $ \displaystyle\lim _{x \rightarrow 0^{+}} \log _a x=+\infty$, $\displaystyle\lim _{x \rightarrow+\infty} \log _a x=-\infty $\\
\begin{tikzpicture}
\tkzTabInit[lgt=2.2,espcl=2.5]
{$x$/1,$y=\log_a x$/2}
{$0$,$+\infty$}
\tkzTabVar{-/$-\infty$,+/$+\infty$}
\end{tikzpicture}
& \begin{tikzpicture}
\tkzTabInit[lgt=2.2,espcl=2.5]
{$x$/1,$y=\log_a x$/2}
{$0$,$+\infty$}
\tkzTabVar{+/$+\infty$,-/$-\infty$}
\end{tikzpicture}\\
\begin{tikzpicture}[
>=stealth,declare function={
f(\x)=ln(\x)/ln(2);
xmin=-3;xmax=5;ymin=-3;ymax=3;}]
\draw[->, thick] (xmin,0)--(xmax,0) node [below left]{$x$};
\draw[->,thick] (0,ymin)--(0,ymax) node [below left]{$y$};
\node[below left] at (0, 0) {$O$};
\clip (xmin,ymin) rectangle (xmax,ymax);
\draw[smooth,samples=500,very thick, blue,domain=0.001:5] plot(\x,{f(\x)});
\end{tikzpicture} & \begin{tikzpicture}[
>=stealth,declare function={
f(\x)=-ln(\x)/ln(2);
xmin=-3;xmax=5;ymin=-3;ymax=3;}]
\draw[->, thick] (xmin,0)--(xmax,0) node [below left]{$x$};
\draw[->,thick] (0,ymin)--(0,ymax) node [below left]{$y$};
\node[below left] at (0, 0) {$O$};
\clip (xmin,ymin) rectangle (xmax,ymax);
\draw[smooth,samples=500,very thick, blue,domain=0.001:5] plot(\x,{f(\x)});
\end{tikzpicture}\\
$ \displaystyle\lim _{x \rightarrow 0^{+}} \log _a x=-\infty$, $\displaystyle\lim _{x \rightarrow+\infty} \log _a x=+\infty $ & $ \displaystyle\lim _{x \rightarrow 0^{+}} \log _a x=+\infty$, $\displaystyle\lim _{x \rightarrow+\infty} \log _a x=-\infty $\\
\begin{tikzpicture}
\tkzTabInit[lgt=2.2,espcl=2.5]
{$x$/1,$y=\log_a x$/2}
{$0$,$+\infty$}
\tkzTabVar{-/$-\infty$,+/$+\infty$}
\end{tikzpicture}
& \begin{tikzpicture}
\tkzTabInit[lgt=2.2,espcl=2.5]
{$x$/1,$y=\log_a x$/2}
{$0$,$+\infty$}
\tkzTabVar{+/$+\infty$,-/$-\infty$}
\end{tikzpicture}\\
\begin{tikzpicture}[
>=stealth,declare function={
f(\x)=ln(\x)/ln(2);
xmin=-3;xmax=5;ymin=-3;ymax=3;}]
\draw[->, thick] (xmin,0)--(xmax,0) node [below left]{$x$};
\draw[->,thick] (0,ymin)--(0,ymax) node [below left]{$y$};
\node[below left] at (0, 0) {$O$};
\clip (xmin,ymin) rectangle (xmax,ymax);
\draw[smooth,samples=500,very thick, blue,domain=0.001:5] plot(\x,{f(\x)});
\end{tikzpicture} & \begin{tikzpicture}[
>=stealth,declare function={
f(\x)=-ln(\x)/ln(2);
xmin=-3;xmax=5;ymin=-3;ymax=3;}]
\draw[->, thick] (xmin,0)--(xmax,0) node [below left]{$x$};
\draw[->,thick] (0,ymin)--(0,ymax) node [below left]{$y$};
\node[below left] at (0, 0) {$O$};
\clip (xmin,ymin) rectangle (xmax,ymax);
\draw[smooth,samples=500,very thick, blue,domain=0.001:5] plot(\x,{f(\x)});
\end{tikzpicture}
\end{booktabs}
\end{document}
```
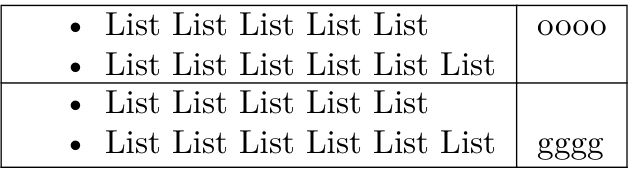
How can I use Items like this?