# Using an expandable macro in a path
The following defines a macro `\bars` that should be used as part of a Ti*k*Z path. It'll draw your bar charts using `node`s. The bars are numbered from left to right, starting at index 0. Each bar consists of two nodes, one being the bar and named `bar<n>` (`<n>` being the index), and the other being the number beneath it named `number<n>`.
The macro takes the following arguments:
- an optional argument in `[]` containing key=value input
- an optional argument in `()`, if this is given each node name will be prefixed with `#2-` (so the contents of that argument followed by a hyphen)
- a mandatory argument containing the list of values of your bars
Your values can be floating point numbers, but values smaller than zero aren't supported.
`\bars` is fully expandable and will expand to a bunch of idiomatic Ti*k*Z instructions to draw the charts.
Each chart element has an associated Ti*k*Z style you might change to contain default values (only change stuff below the comments `%% user specified styling`).
The chart will start with the south west corner of the zeroth bar at the current point of the path. Afterwards the current path will be located at the south east corner of the last bar (moved to the left by one `line width`).
## Key=Val interface
The following keys are supported in `#1`:
- `unit` the width of the bars and the height of the value 1 (initially 5mm)
- `line width` the width of the lines surrounding the bars, the lines will not add to the `unit`-width, meaning that thick line widths will lead to thinner overall charts, as neighbouring bars share their vertical lines.
- `number options` additional Ti*k*Z options to use for the height numbers below the bars
- `rectangle options` additional Ti*k*Z options to use for the rectangles drawn over the bar chart
- `rectangle number` additional Ti*k*Z options to use for the rectangle number nodes
- `rectangles` this one is special and described below.
Every unknown key is used as additional Ti*k*Z options to use for the bar nodes.
### The `rectangles` key
The `rectangles` key accepts an optional argument (will be used as additional Ti*k*Z options for the rectangles additionally to the `rectangle options`). It should also get a comma separated list of number ranges that specify which bars should be covered by rectangles in the form `<a>-<b>` with `<a>` the first and `<b>` the last bar to cover (indexed starting with 0).
## MWE:
```
\documentclass[tikz,border=3.14]{standalone}
\usepackage{expkv-cs}
\makeatletter
\ekvcHashAndForward\bars@kv\bars@do
{
unit = 5mm
,line width = \pgflinewidth
,number options = {}
,rectangles = {}
,rectangle options = {}
,rectangle number = {}
,...
}
\newcommand\bars@do[3]
{%
\expanded{\unexpanded{\bars@firstbar{#1}{#2}}\ekvcsvloop\bars@bar{#3}}%
\bars@done
\ekvcValueSplitFast{rectangle options}{#1}%
{\ekvcValueSplitFast{rectangles}{#1}\bars@rectangles}{#2}{#3}{#1}%
}
\newcommand\bars@firstbar[3]{#30{#1}{#2}}
\newcommand\bars@done[3]{}
\newcommand\bars@bar[5]
{%
\if1\fpeval{(#4)<0}\ekverr{bars}{Values smaller than 0 not supported}\fi
node
[
/bars/bar={\ekvcValue{line width}{#2}}{\ekvcValue{unit}{#2}}{#4}%
\ekvcValue{...}{#2}%
]
(#3bar#1)
{}
node [/bars/number,\ekvcValue{number options}{#2}]
(#3number#1) at (#3bar#1.south) {#4}
(#3bar#1.south east) ++({-(\ekvcValue{line width}{#2})},0)
\expandafter#5\expandafter{\the\numexpr#1+1\relax}{#2}{#3}%
}
\newcommand\bars@rectangles[1]
{%
\ekvoptargTF
\bars@rectangles@opts
{\bars@rectangles@noopts{#1}}%
#1\mark\stop
}
\long\def\bars@rectangles@opts#1#2\mark\stop#3#4#5#6%
{\expanded{\ekvcsvloop{\bars@rectangle{#3,#1}{#4}{#5}{#6}}{#2}}}
\long\def\bars@rectangles@noopts#1#2\stop#3#4#5#6%
{\expanded{\ekvcsvloop{\bars@rectangle{#3}{#4}{#5}{#6}}{#1}}}
\newcommand\bars@rectangle[5]{\bars@rectangle@split#5\stop{#1}{#2}{#3}{#4}}
\long\def\bars@rectangle@split#1-#2\stop#3#4#5#6%
{%
% Args: >>=
% #1: first bar of rectangle
% #2: last bar of rectangle
% #3: options for rectangles
% #4: naming prefix
% #5: list of bars
% #6: list of options
% =<<
\expanded
{%
\unexpanded{\bars@rectangle@firstheight{#1}{#2}}%
\ekvcsvloop\bars@rectangle@height{#5}%
}%
\bars@rectangle@done
\bars@rectangle@stop{#3}{#4}{#6}%
}
\newcommand\bars@rectangle@firstheight[3]{#30{Inf}0{#1}{#2}}
\newcommand\bars@rectangle@height[7]% >>=
{%
% Args: >>=
% #1: current bar
% #2: minimum height
% #3: bar of minimum height
% #4: first bar of rectangle
% #5: last bar of rectangle
% #6: current bar's height
% #7: next iteration
% =<<
\ifnum#1>#5
\bars@rectangle@do{#2}{#3}{#4}{#5}%
\fi
\expandafter#7\expanded
{%
{\the\numexpr#1+1\relax}%
\ifnum#4>#1
{#2}%
{#3}%
\else
\if1\fpeval{(#6)<(#2)}%
{#6}%
{#1}%
\else
{#2}%
{#3}%
\fi
\fi
}%
{#4}{#5}%
}% =<<
\newcommand\bars@rectangle@done[5]
{%
% Args: >>=
% #1: current bar
% #2: minimum height
% #3: bar of minimum height
% #4: first bar of rectangle
% #5: last bar of rectangle
% =<<
\ifnum#1>#5
\bars@rectangle@do{#2}{#3}{#4}{#5}%
\fi
\ekverr{bars}{Rectangle out of bounds}%
\bars@rectangle@cleanup
}
\long\def\bars@rectangle@cleanup#1\bars@rectangle@stop#2#3#4{}
\long\def\bars@rectangle@do#1#2#3#4\fi#5\bars@rectangle@stop#6#7#8%
{%
% Args: >>=
% #1: minimum height
% #2: bar of minimum height
% #3: first bar of rectangle
% #4: last bar of rectangle
% #5: garbage
% #6: options for rectangles
% #7: naming prefix
% #8: list of options
% =<<
\fi
node
[
/bars/rectangle=%
{\the\numexpr#4-#3+1\relax}%
{#1}%
{\ekvcValue{unit}{#8}}%
{\ekvcValue{line width}{#8}}%
,#6%
]
(lastrectangle)
at (#7bar#3.south west)
{}
node
[/bars/rectangle number,\ekvcValue{rectangle number}{#8}]
at (lastrectangle)
{\fpeval{(#4-#3+1)*(#1)}}
}
\newcommand\bars{\unexpanded\expanded{{\iffalse}}\fi\bars@args}
\NewExpandableDocumentCommand \bars@args { O{} d() m }
{%
\IfNoValueTF{#2}%
{\bars@kv{#1}{}}%
{\bars@kv{#1}{#2-}}%
{#3}%
\iffalse{{\fi}}%
}
\makeatother
% default options for bars' underlying TikZ nodes go here
\pgfqkeys{/bars}
{%
bar/.style n args ={3}%
{%
% #1: line width
% #2: unit
% #3: bar height
%% positioning relevant options
anchor=south west
,inner sep={-.5*(#1)}
,outer sep={.5*(#1)}
,line width={#1}
,text width={#2}
,text height={#3*(#2)}
,text depth=0pt
,minimum size=0pt
%% user specified styling
,draw
}%
,number/.style=%
{%
%% positioning relevant options
anchor=north
%% user specified styling
}
,rectangle/.style n args ={4}%
{%
% #1: number of bars
% #2: height
% #3: unit
%% positioning relevant options
anchor=south west
,inner sep={-.5*(#4)}
,outer sep={.5*(#4)}
,line width={#4}
,text width={#1*(#3)-(#1-1)*(#4)}
,text height={(#2)*(#3)}
,text depth=0pt
,minimum size=0pt
%% user specified styling
,draw
,fill
}%
,rectangle number/.style =%
{%
%% positioning relevant options
%% user specified styling
color=white
,font=\bfseries
}
}
\begin{document}
\begin{tikzpicture}
\path
(0,0)
\bars[line width=3pt](first){4,2.5,3,1}
(first-bar3.south east) ++(1,0)
\bars[fill=gray]{2,7,1,8,3,0,5,4}
(0,-5)
\bars[fill=gray,rectangles=0-2]{4,2.5,3,1}
(bar3.south east) ++(1,0)
\bars[fill=gray,rounded corners,rectangles=[{purple,rounded corners}]{6-7,0-2}]{2,7,1,8,3,0,5,4}
;
\end{tikzpicture}
\end{document}
```
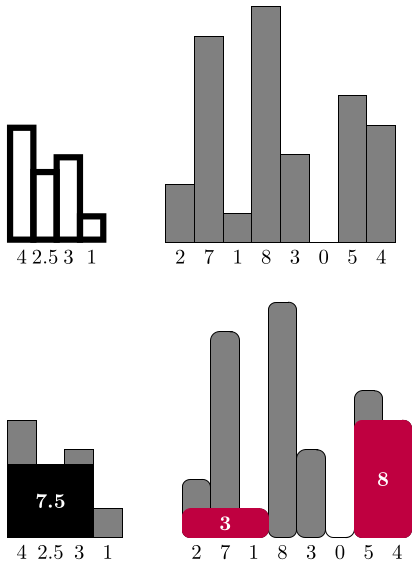
Output: