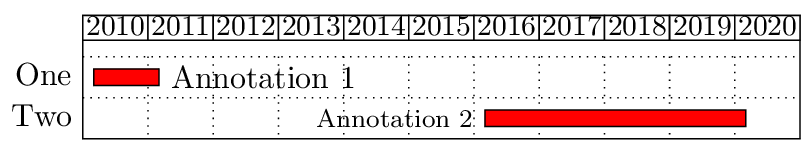
You can use the Ti*k*Z `label` key (ultimately, `/tikz/label`) to create an additional node next to each `pgfgantt` bar node:
```
\documentclass{standalone}
\usepackage{pgfgantt}
\begin{document}
\begin{ganttchart}[
hgrid,
vgrid={*{11}{draw = none}, dotted},
time slot format = isodate-yearmonth,
time slot unit = month,
x unit = 0.60mm,
y unit title = 3.0ex,
y unit chart = 3.0ex,
]{2010-01}{2020-12}
%
\gantttitlecalendar{year} \\
%
\ganttbar[bar/.append style={
fill=red, label=right:{Annotation~1}}]
{One}{2010-03}{2011-02} \\
\ganttbar[bar/.append style={
fill=red, label={[font=\footnotesize]left:{Annotation~2}}}]
{Two}{2016-03}{2020-02}
\end{ganttchart}
\end{document}
```
Here is a more evolved, and hopefully user-friendly, variant of the same technique. It implements a `/tikz/mylabel` key whose syntax is `mylabel={opts=..., angle=..., text=...}` with user-customizable defaults for `opts` and `angle` (the `text` key is mandatory; not giving it is an error).
```
\documentclass{standalone}
\usepackage{pgfgantt}
\makeatletter
\newcommand*{\manuelk@ganttlabel}[3]{%
\tikzset{label={[{#1}]#2:{#3}}}% we want a ':' of catcode 12
}
\ExplSyntaxOn
\cs_new_eq:NN \manuelk_ganttlabel:nnn \manuelk@ganttlabel % simple alias
% Variant that feeds the “value” of each argument to \manuelk@ganttlabel
\cs_generate_variant:Nn \manuelk_ganttlabel:nnn { VVV }
\cs_new_eq:NN \myganttlabel \manuelk_ganttlabel:VVV
\ExplSyntaxOff
\let\manuelkganttlabelfont\empty % no font change by default
\tikzset{
mylabel/.code={%
\pgfqkeys{/manuelk/gantt/mylabel}{#1, @opts/.get=\manuelk@ganttlabel@opts}%
\myganttlabel{\manuelk@ganttlabel@opts}
{\manuelk@ganttlabel@angle}
{\manuelk@ganttlabel@text}%
},
/manuelk/gantt/mylabel/.cd,
opts/.style={/manuelk/gantt/mylabel/@opts/.append={,#1}},
override opts/.style={/manuelk/gantt/mylabel/@opts={#1}},
angle/.store in=\manuelk@ganttlabel@angle,
text/.store in=\manuelk@ganttlabel@text,
% Defaults (no default for 'text' so that a missing text triggers an error)
@opts/.initial={font=\manuelkganttlabelfont},
angle=right,
}
\makeatother
% User code starts here
\let\manuelkganttlabelfont\small % change the default font for 'mylabel' texts
\pgfkeys{
/pgfgantt/bar/.append style={fill=red},
% Users can change the defaults here
/manuelk/gantt/mylabel/.cd,
% angle=left,
% You can use 'override opts' instead of 'opts' to *replace* the default
% options in /manuelk/gantt/mylabel/@opts ('opts' only appends to them).
opts={text=green},
}
\begin{document}
\begin{ganttchart}[
hgrid,
vgrid={*{11}{draw = none}, dotted},
time slot format = isodate-yearmonth,
time slot unit = month,
x unit = 0.60mm,
y unit title = 3.0ex,
y unit chart = 3.0ex,
]{2010-01}{2020-12}
%
\gantttitlecalendar{year} \\
%
\ganttbar[bar/.append style={
mylabel={opts={font=\manuelkganttlabelfont\bfseries, text=blue},
text=Annotation~1}}]
{One}{2010-03}{2011-02} \\
\ganttbar[bar/.append style={mylabel={angle=left, text=Annotation~2}}]
{Two}{2016-03}{2020-02}
\end{ganttchart}
\end{document}
```
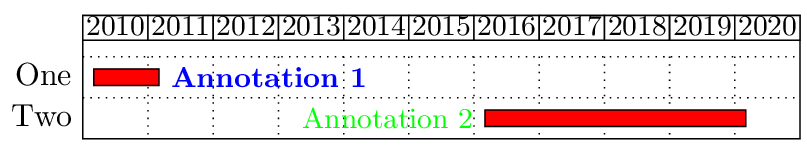
Note that you can place annotations at arbitrary angles, using for instance `angle=45`.
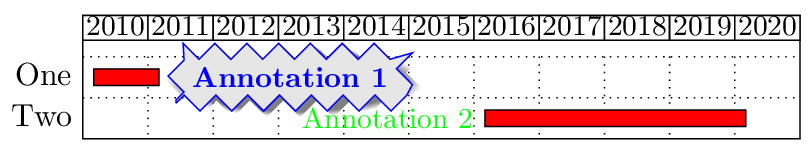
# Even more fun
```
\documentclass{standalone}
\usepackage{pgfgantt}
\usetikzlibrary{decorations.pathmorphing, shadows}
(...)
\ganttbar[bar/.append style={
mylabel={opts={circular drop shadow={shadow scale=1.05},
decorate, decoration=zigzag,
inner sep=0.5em, draw=blue, text=blue,
fill=gray!20, label distance=0.5em,
font=\manuelkganttlabelfont\bfseries},
text=Annotation~1}}]
{One}{2010-03}{2011-02} \\
(...)
```