Miguel Huaylla

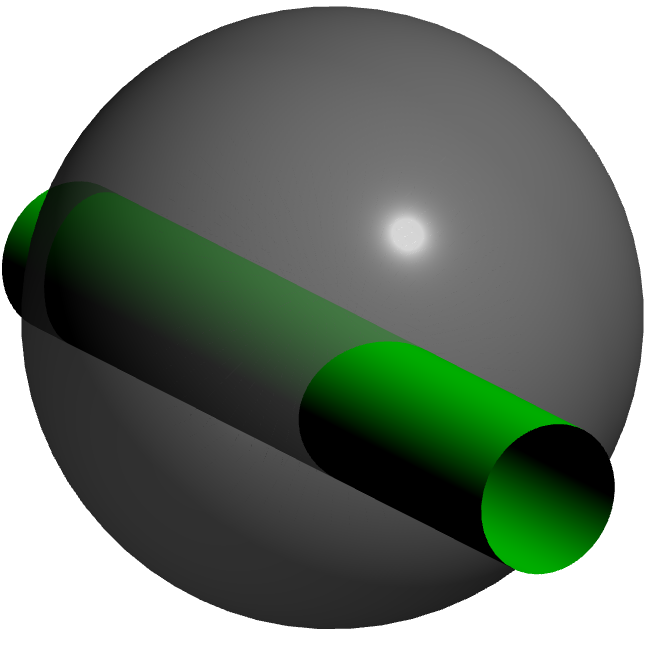
I am researching about Efimov's theorem, to illustrate what is being worked I need graphs this: 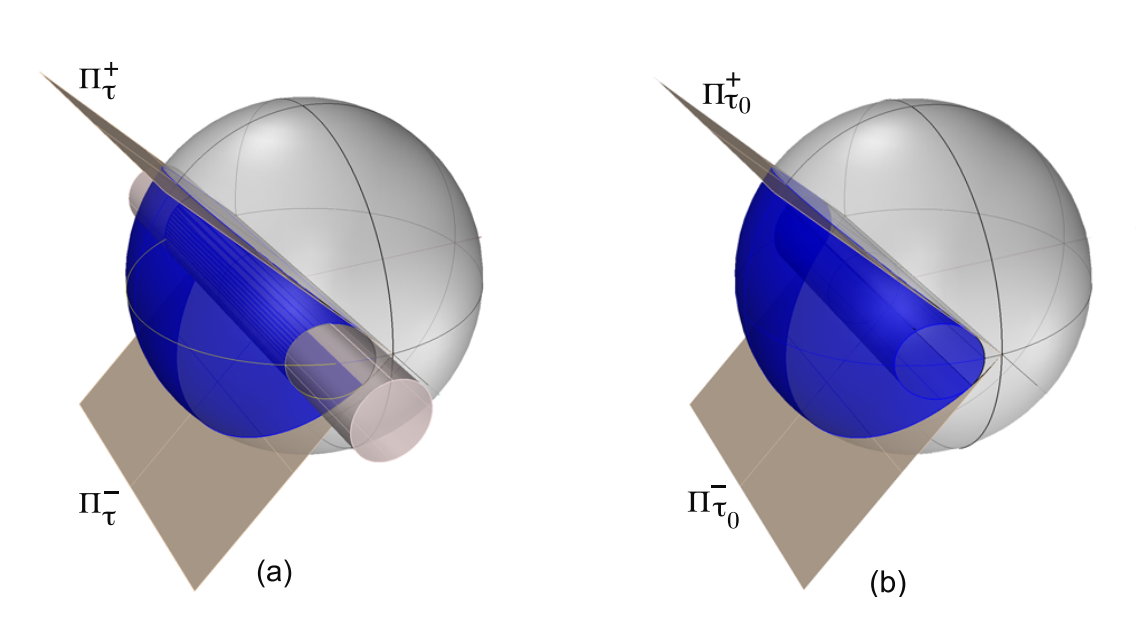 the elliptical cylinder must have as its center (x,-1/3,0), in this way the cylinder must be parallel to the x axis. Where the planes are tangent to the cylinder and seen in the yz-plane, we have something like this 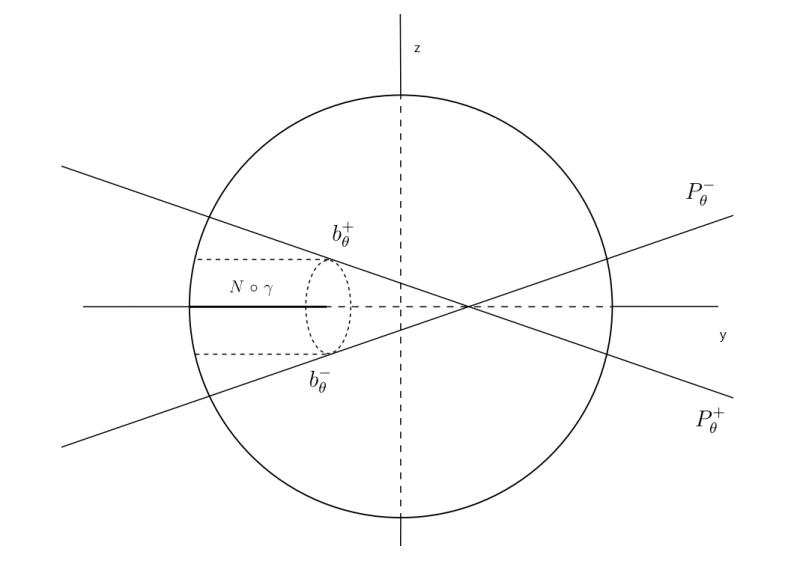 I'm aware that I do not know much about making graphics in Latex but I have tried Asymptote and Tikz but I have not achieved anything, I would appreciate someone to help me. My attempt I did it in http://asymptote.ualberta.ca/ : ``` settings.render = 8; size(10cm, 0); import three; import solids; currentprojection = orthographic(2,0.5,1); draw(unitsphere, gray + opacity(0.7)); triple v=(-1/2,-1,0); real r=0.25; real h=3; triple axis=X+Y; surface cylinder=shift(v)*align(unit(axis))*scale(r,r,h)*unitcylinder; draw(cylinder,green,render(merge=true)); revolution r=cylinder(v,r,h,axis); draw(surface(r),green,render(merge=true)); ``` **Output**