Anonymous 1123

[This question](https://tex.stackexchange.com/questions/600723/replicate-axis-region-reference-frame-and-drawing-to-it-saving-coordinates-2d) asked five days ago, and there is no answer. I cannot answer this question. How can to draw it?
Top Answer
user 3.14159

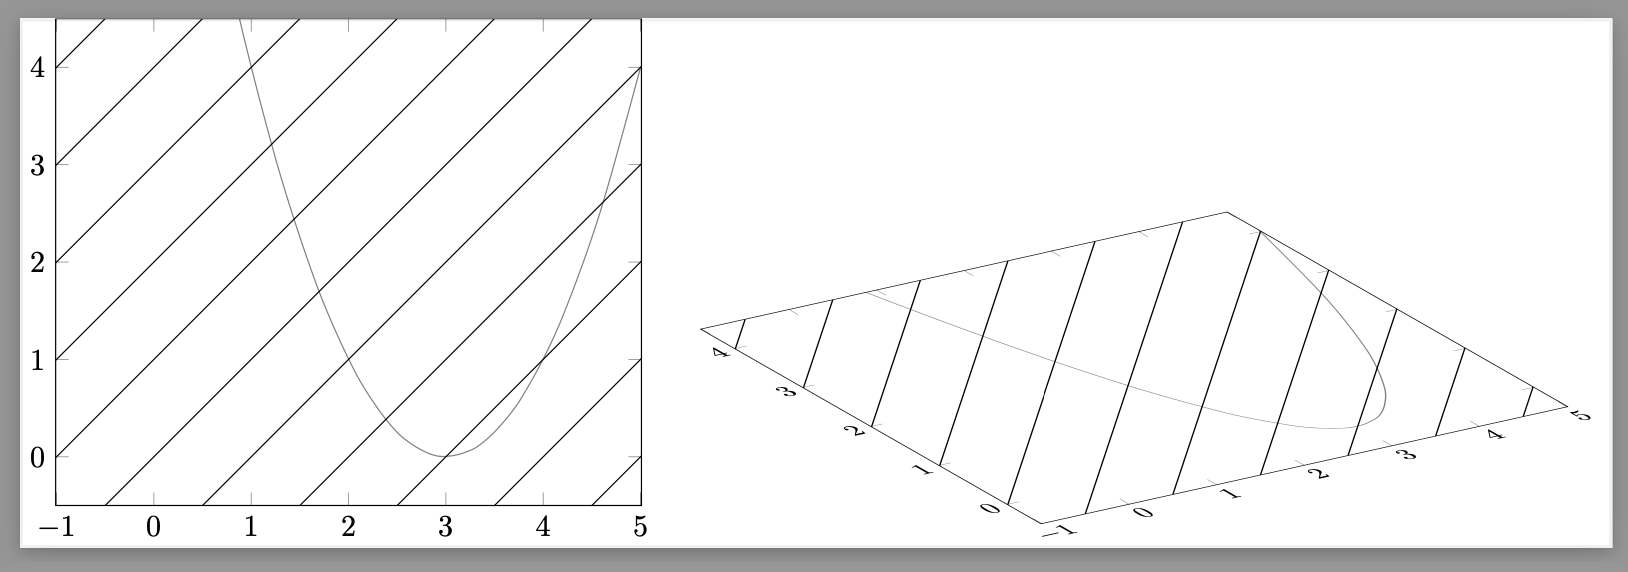
This is not really an answer because I think what the OP wants is dangerous. One *can* make it work, but I do not recommend to put the axis in scope of a plane of the `3d` library. Such constructions are fragile, to see this try e.g. to introduce layers. What might be useful, though, is the `get xy window` key which I more or less copied from [here](https://topanswers.xyz/tex?q=1741#a1971). This allows you to avoid the `calc` methods the OP is using.
```
\documentclass{standalone}
\usepackage{pgfplots}
\pgfplotsset{compat=1.18}
\usetikzlibrary{3d}
\makeatletter
\pgfplotsset{get xy window/.code={\pgfkeys{/pgf/fpu}%
\pgfmathfloattofixed{\pgfplots@xmax}\let\myxmax\pgfmathresult
\pgfmathfloattofixed{\pgfplots@xmin}\let\myxmin\pgfmathresult
\pgfmathfloattofixed{\pgfplots@ymax}\let\myymax\pgfmathresult
\pgfmathfloattofixed{\pgfplots@ymin}\let\myymin\pgfmathresult
\pgfkeys{/pgf/fpu=false}},
window/ds/.initial=1}
\makeatother
\pgfplotsset{draw xy background/.style={%
execute at begin axis={\pgfplotsset{get xy window}%
\pgfmathsetmacro{\myxmineff}{\myxmin-\myymax+\myymin}%
\pgfmathsetmacro{\myxminnext}{\myxmineff+\pgfkeysvalueof{/pgfplots/window/ds}}%
\pgfmathsetmacro{\myxmaxeff}{\myxmax+\myymax-\myymin}%
\draw[window background] foreach \X in {\myxmineff,\myxminnext,...,\myxmax}
{(axis cs:\X,\myymin) -- ++
(axis direction cs:\myymax-\myymin,\myymax-\myymin)};
}}}
\tikzset{window background/.style={thin}}
\begin{document}
\begin{tikzpicture}[line join=round,line cap=round]
\begin{axis}[axis equal, xmin=-.5, xmax=4.5, ymin=-.5, ymax=4.5,
draw xy background]
\addplot[black, opacity=0.5,smooth] {(x-3)^2};
\end{axis}
\end{tikzpicture}
\begin{tikzpicture}[line join=round,line cap=round]
\begin{scope}[
x={(-0.7cm,0.4cm)},
y={(.9cm,.2cm)},
z={(0cm,1cm)},
canvas is yx plane at z=0
]
\begin{axis}[axis equal, xmin=-.5, xmax=4.5, ymin=-.5, ymax=4.5,
draw xy background]
\addplot[black, opacity=0.5,smooth] {(x-3)^2};
\end{axis}
\end{scope}
\end{tikzpicture}
\end{document}
```