topnush

Consider the following slide.
```
\documentclass{beamer}
\usepackage{tikz}
\begin{document}
\begin{frame}[fragile]{}
\begin{center}
\begin{tikzpicture}
\draw[fill=blue!50] (0,0) ellipse (5cm and 1cm);
\node [circle, fill=red, left=2cm](s) {s};
\node [circle, fill=red, right=2cm](t) {t};
\end{tikzpicture}
\end{center}
\end{frame}
\end{document}
```
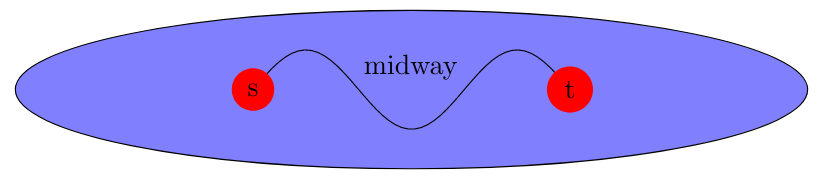
How can I draw an S shaped curve between node s and t that I can label with some text in the middle.
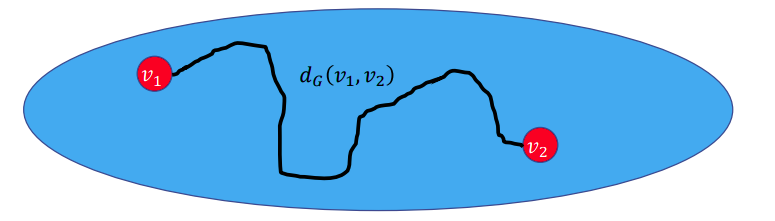
Something like (but more beautiful):
Top Answer
user 3.14159

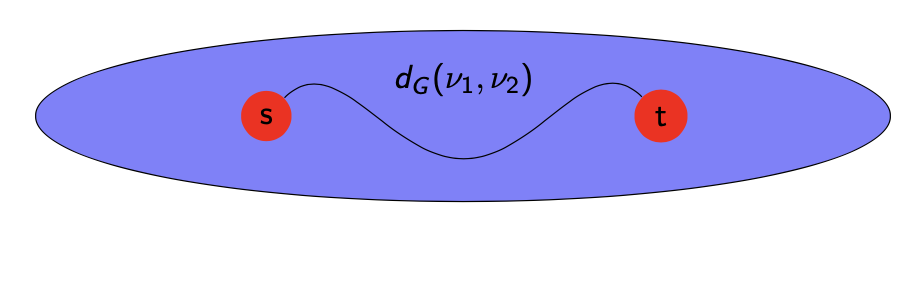
One option is to play with the `in` and `out` keys.
```
\documentclass{beamer}
\usepackage{tikz}
\usetikzlibrary{calc}
\begin{document}
\begin{frame}[fragile]{}
\begin{center}
\begin{tikzpicture}
\draw[fill=blue!50] (0,0) ellipse[x radius=5cm,y radius=1cm];
\node [circle, fill=red, left=2cm](s) {s};
\node [circle, fill=red, right=2cm](t) {t};
\draw (s) to[out=45,in=180] ($($(s)!0.5!(t)$)+(0,-0.5)$)
node[above=6mm] {$d_G(\nu_1,\nu_2)$}
to[out=0,in=135] (t);
\end{tikzpicture}
\end{center}
\end{frame}
\end{document}
```
Answer #2
joulev

As I said in the chat, a sine curve. Finding the right function might get pretty complicated if you place the nodes randomly though.
```
\documentclass[tikz,margin=3mm]{standalone}
\begin{document}
\begin{tikzpicture}
\draw[fill=blue!50] (0,0) ellipse (5cm and 1cm);
\draw plot[samples=50,domain=-2:2] (\x,{-.5*cos(deg(3*pi*\x/4))});
\node[circle,fill=red,left=2cm,anchor=center] (s) {s};
\node[circle,fill=red,right=2cm,anchor=center] (t) {t};
\path (s) -- (t) node[midway,above] {midway};
\end{tikzpicture}
\end{document}
```