This is the current state of affairs, taking into account some suggestions from your comment. I am not really sure about some of the things, especially the globally defined `\JETwidth` and `\JETheight`, which are attmepts to determine the dimensions of the cross sections. I also did not try plots with very large or small values, and would not be surprised at all if they failed. In that case one may perhaps use `\addplot` commands to set the relevant coordinates. Anyway, with all the `window` (NOT Windows! :smile_cat:) styles from the code below, you can add the windows in an axis e.g. via
```
\begin{axis}[draw window=xz',customaxis]
\addplot3[surf] {exp(-x-y*y)};
\end{axis}
```
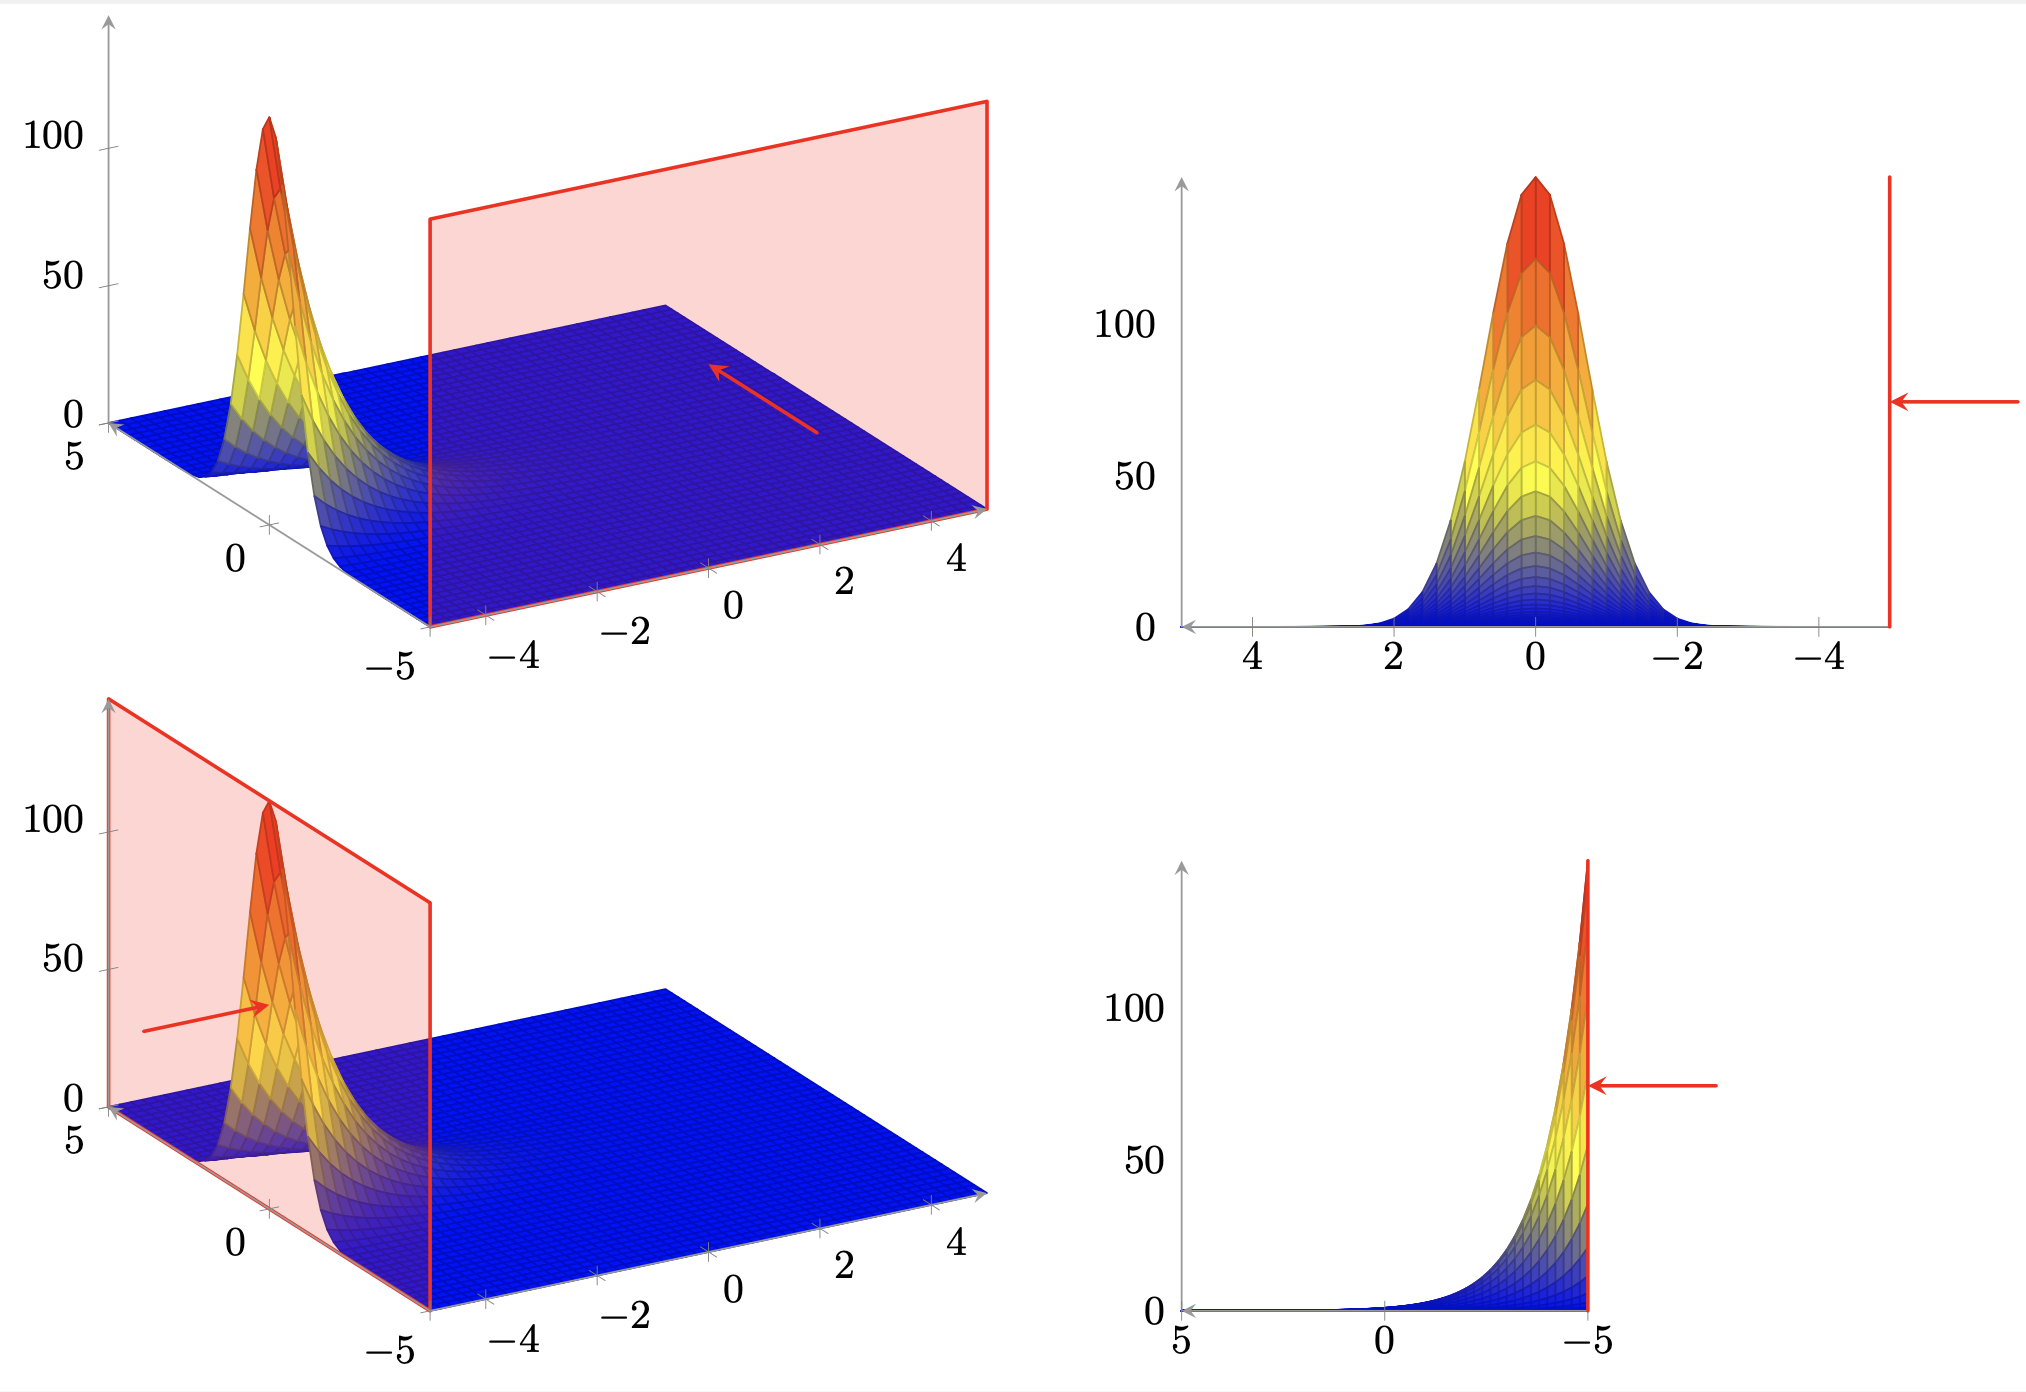
Here, `xz'` means that the window is in the `xz` plane, where the prime indicates that it is at the side with the minimal `y` values, without a prime it would be at `ymax`. (A perhaps useful ingredient of the answer is the `get window` key which finds the `xmax`, `xmin`, `ymax`, `ymin`, `zmax` and `zmin` of an axis. While I am pretty sure that similar codes exist somewhere else, this is the first time that I tried to extract them. Quite possibly better variants can be found elsewhere but I am not aware of a concrete example.) The appearance of the window and the arrows is controlled by the `window` and `window arrow` styles and the `window arrow length` key which expects a length.
Here is the complete example.
```
\documentclass{standalone}
\usepackage{pgfplots}
\pgfplotsset{compat=1.17}
\usetikzlibrary{calc}
\makeatletter
\pgfplotsset{get window/.code={\pgfkeys{/pgf/fpu}%
\pgfmathfloattofixed{\pgfplots@xmax}\let\myxmax\pgfmathresult
\pgfmathfloattofixed{\pgfplots@xmin}\let\myxmin\pgfmathresult
\pgfmathfloattofixed{\pgfplots@ymax}\let\myymax\pgfmathresult
\pgfmathfloattofixed{\pgfplots@ymin}\let\myymin\pgfmathresult
\pgfmathfloattofixed{\pgfplots@zmax}\let\myzmax\pgfmathresult
\pgfmathfloattofixed{\pgfplots@zmin}\let\myzmin\pgfmathresult
\pgfkeys{/pgf/fpu=false}}}
\makeatother
\pgfplotsset{draw window/.is choice,draw window/xz/.style={%
execute at end axis={\pgfplotsset{get window}%
\path[window] (\myxmin,\myymax,\myzmin)
-- (\myxmax,\myymax,\myzmin)
-- (\myxmax,\myymax,\myzmax)
-- (\myxmin,\myymax,\myzmax) -- cycle;
\path let \p1=($(axis cs:\myxmax,\myymax,\myzmin)-(axis cs:\myxmax,\myymin,\myzmin)$),
\p2=($(axis cs:\myxmin,\myymax,\myzmax)-(axis cs:\myxmin,\myymax,\myzmin)$)
in \pgfextra{\pgfmathparse{veclen(\x1,\y1)}\xdef\JETwidth{\pgfmathresult pt}%
\pgfmathparse{veclen(\x2,\y2)}\xdef\JETheight{\pgfmathresult pt}};
\path[window arrow] let \p1=(axis direction cs:0,1,0),
\n1={scalar(\pgfkeysvalueof{/tikz/window arrow length}/veclen(\x1,\y1))}
in (\myxmin/2+\myxmax/2,\myymax,\myzmin/2+\myzmax/2)
-- ++ ({\n1*\x1},{\n1*\y1});
}},draw window/xz'/.style={%
execute at end axis={\pgfplotsset{get window}%
\path[window] (\myxmin,\myymin,\myzmin)
-- (\myxmax,\myymin,\myzmin)
-- (\myxmax,\myymin,\myzmax)
-- (\myxmin,\myymin,\myzmax) -- cycle;
\path let \p1=($(axis cs:\myxmax,\myymin,\myzmin)-(axis cs:\myxmin,\myymin,\myzmin)$),
\p2=($(axis cs:\myxmin,\myymin,\myzmax)-(axis cs:\myxmin,\myymin,\myzmin)$)
in \pgfextra{\pgfmathparse{veclen(\x1,\y1)}\xdef\JETwidth{\pgfmathresult pt}%
\pgfmathparse{veclen(\x2,\y2)}\xdef\JETheight{\pgfmathresult pt}};
\path[window arrow] let \p1=(axis direction cs:0,-1,0),
\n1={scalar(\pgfkeysvalueof{/tikz/window arrow length}/veclen(\x1,\y1))}
in (\myxmin/2+\myxmax/2,\myymin,\myzmin/2+\myzmax/2)
-- ++ ({\n1*\x1},{\n1*\y1});
}},draw window/yz/.style={%
execute at end axis={\pgfplotsset{get window}%
\path[window] (\myxmax,\myymin,\myzmin)
-- (\myxmax,\myymax,\myzmin)
-- (\myxmax,\myymax,\myzmax)
-- (\myxmax,\myymin,\myzmax) -- cycle;
\path let \p1=($(axis cs:\myxmin,\myymax,\myzmin)-(axis cs:\myxmin,\myymin,\myzmin)$),
\p2=($(axis cs:\myxmin,\myymin,\myzmax)-(axis cs:\myxmin,\myymin,\myzmin)$)
in \pgfextra{\pgfmathparse{veclen(\x1,\y1)}\xdef\JETwidth{\pgfmathresult pt}%
\pgfmathparse{veclen(\x2,\y2)}\xdef\JETheight{\pgfmathresult pt}};
\path[window arrow] let \p1=(axis direction cs:1,0,0),
\n1={scalar(\pgfkeysvalueof{/tikz/window arrow length}/veclen(\x1,\y1))}
in (\myxmax,\myymin/2+\myymax/2,\myzmin/2+\myzmax/2)
-- ++ ({\n1*\x1},{\n1*\y1});
}},draw window/yz'/.style={%
execute at end axis={\pgfplotsset{get window}%
\path[window] (\myxmin,\myymin,\myzmin)
-- (\myxmin,\myymax,\myzmin)
-- (\myxmin,\myymax,\myzmax)
-- (\myxmin,\myymin,\myzmax) -- cycle;
\path let \p1=($(axis cs:\myxmin,\myymax,\myzmin)-(axis cs:\myxmin,\myymin,\myzmin)$),
\p2=($(axis cs:\myxmin,\myymin,\myzmax)-(axis cs:\myxmin,\myymin,\myzmin)$)
in \pgfextra{\pgfmathparse{veclen(\x1,\y1)}\xdef\JETwidth{\pgfmathresult pt}%
\pgfmathparse{veclen(\x2,\y2)}\xdef\JETheight{\pgfmathresult pt}};
\path[window arrow] let \p1=(axis direction cs:-1,0,0),
\n1={scalar(\pgfkeysvalueof{/tikz/window arrow length}/veclen(\x1,\y1))}
in (\myxmin,\myymin/2+\myxmax/2,\myzmin/2+\myzmax/2)
-- ++ ({\n1*\x1},{\n1*\y1});
}},
}
\tikzset{window/.style={draw,thick},window arrow/.style={draw,thick,stealth-},
window arrow length/.initial=1cm}
\pgfplotsset{customaxis/.style={
view={-30}{30},
axis lines=left,
axis on top,
axis line style={black!40},
ticklabel style={font=\small},
samples=51,
clip=false,
scaled x ticks=false,scaled y ticks=false,scaled z ticks=false,
}}
\begin{document}
\begin{tikzpicture}[line join=round,line cap=round,
window/.style={draw=red,thick,fill=red,fill opacity=0.2},
window arrow/.style={draw=red,thick,stealth-}
]
\matrix[column sep=2em]{
\begin{axis}[draw window=xz',customaxis]
\addplot3[surf] {exp(-x-y*y)};
\end{axis}
&
\begin{axis}[customaxis,view={-90}{0},width=1.6*\JETwidth,height=1.6*\JETheight]
\addplot3[surf] {exp(-x-y*y)};
\end{axis}
\draw[window] (current axis.south east) -- (current axis.north east);
\draw[window arrow] (current axis.east) --
++(\pgfkeysvalueof{/tikz/window arrow length},0cm);
\\
\begin{axis}[draw window=yz',customaxis]
\addplot3[surf] {exp(-x-y*y)};
\end{axis}
&
\begin{axis}[customaxis,view={180}{0},width=1.6*\JETwidth,height=1.6*\JETheight]
\addplot3[surf] {exp(-x-y*y)};
\end{axis}
\draw[window] (current axis.south east) -- (current axis.north east);
\draw[window arrow] (current axis.east) --
++(\pgfkeysvalueof{/tikz/window arrow length},0cm);
\\
};
\end{tikzpicture}
\end{document}
```