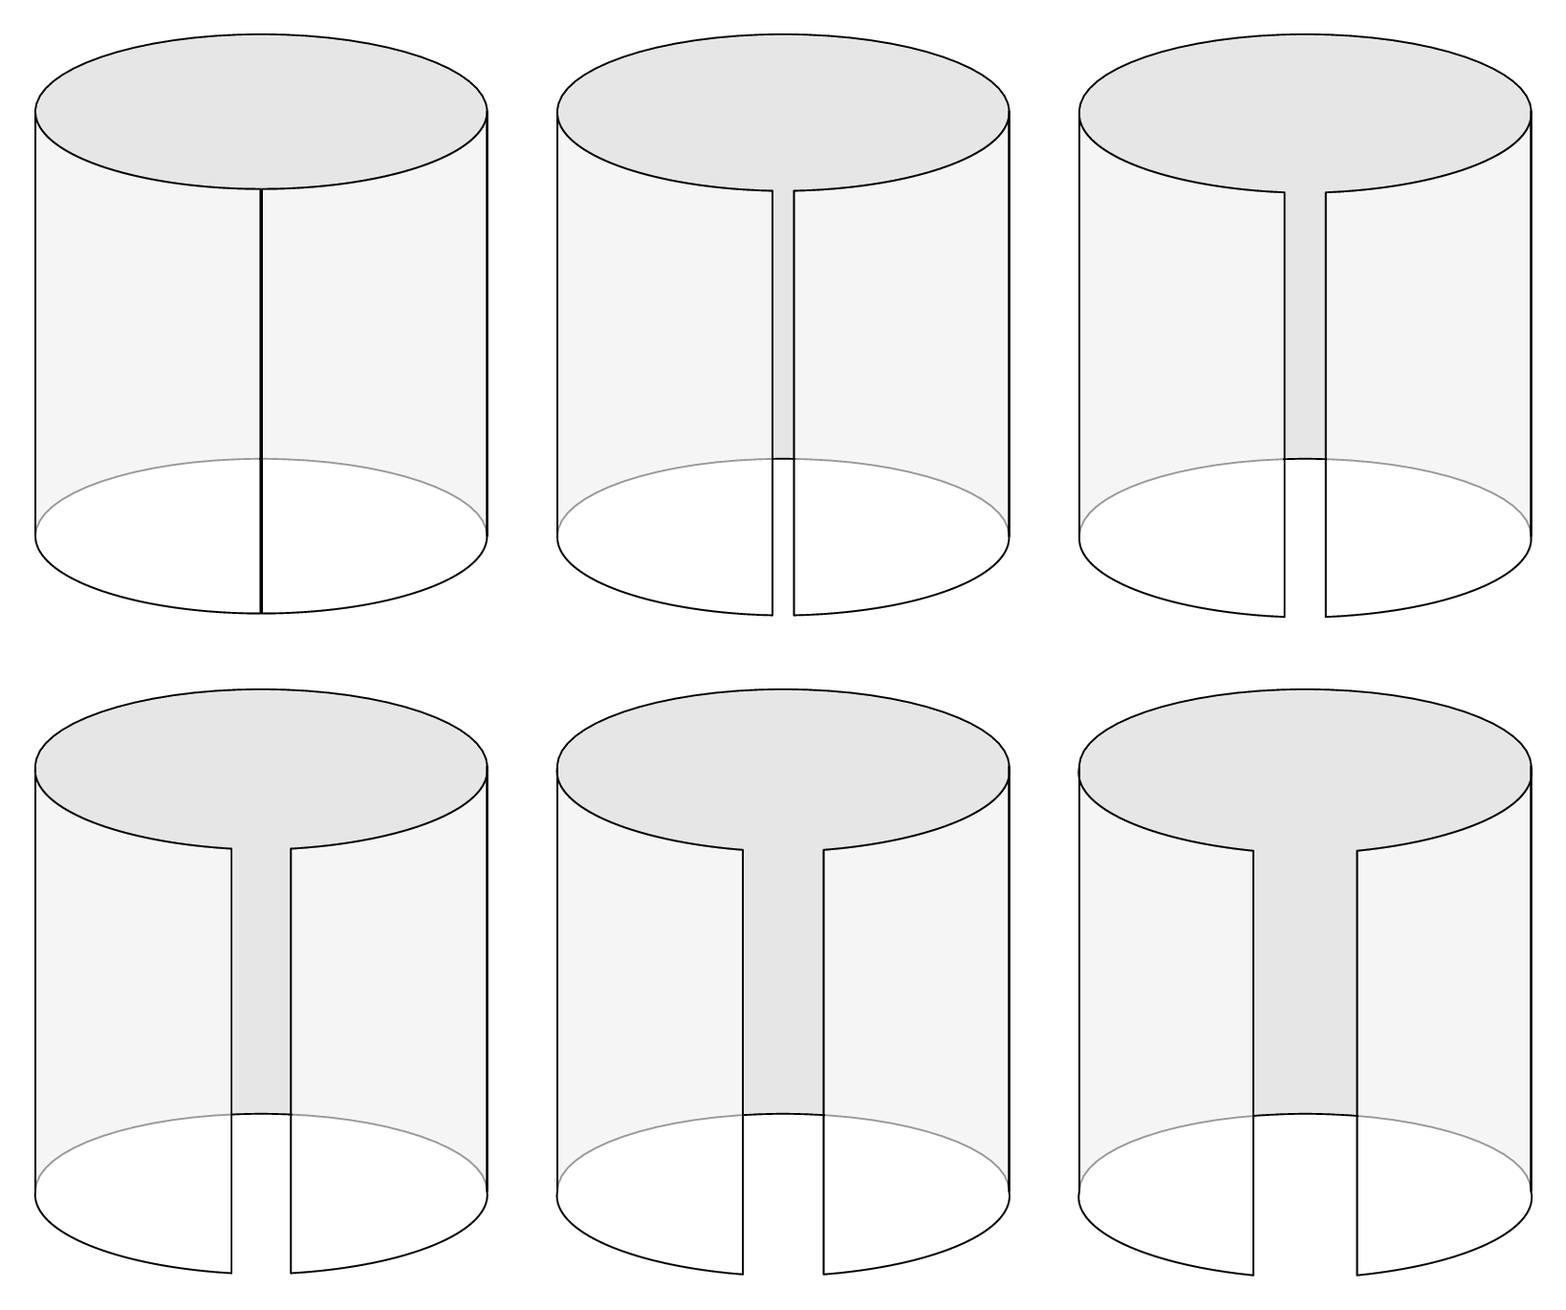
This may be a better animation than the original post, which one can find below. Since LaTeX isn't great for doing elliptical integrals, I computed some with Mathematica, which explains the list of hard-coded numbers in the second loop.
```
\documentclass[tikz,border=3mm]{standalone}
\usetikzlibrary{3dtools} % https://github.com/marmotghost/tikz-3dtools
\begin{document}
\tikzset{declare function={R=2;h=4;},pft/.style={3d/install view={phi=0,theta=70},
same bounding box=A,
line cap=round,line join=round}}
% start with a plane
\begin{tikzpicture}[pft]
\draw[fill=gray!20] (-R*pi,R,0) rectangle (R*pi,R,h);
\end{tikzpicture}
% bend the plane
\foreach \Y/\X in {0.05/3.13959, 0.15/3.12747, 0.25/3.10727,
0.35/3.08049, 0.45/3.04799, 0.55/3.01037, 0.65/2.96802,
0.75/2.92124, 0.85/2.87025, 0.95/2.81522, 1.05/2.75625,
1.15/2.69342, 1.25/2.62677, 1.35/2.5563, 1.45/2.48199,
1.55/2.40377, 1.65/2.32156, 1.75/2.23522, 1.85/2.14457, 1.95/2.04938}
{\begin{tikzpicture}[pft]
\draw[fill=gray!20,x radius=\X,y radius=\Y]
(0,0,0) arc[start angle=0,end angle=180]
-- (-2*\X,0,h) arc[start angle=180,end angle=0] -- cycle
(0,0,0) arc[start angle=180,end angle=0]
-- (2*\X,0,h) arc[start angle=0,end angle=180] -- cycle;
\end{tikzpicture}}
% rotate the halfs
\foreach \X in {0,...,20}
{\begin{tikzpicture}[pft]
\draw[fill=gray!20,radius=R,3d/install view={phi=-4.5*\X}]
(0,0,0) arc[start angle=0,end angle=180-4.5*\X]
-- ({-R+R*cos(180-4.5*\X)},{R*sin(180-4.5*\X)},h)
arc[start angle=180-4.5*\X,end angle=0] -- cycle;
\draw[fill=gray!20,radius=R,3d/install view={phi=4.5*\X}]
(0,0,0) arc[start angle=180,end angle=4.5*\X]
-- ({R+R*cos(4.5*\X)},{R*sin(4.5*\X)},h)
arc[start angle=4.5*\X,end angle=180] -- cycle;
\ifnum\X>0
\draw[fill=white,fill opacity=0.6,radius=R,3d/install view={phi=-4.5*\X}]
({-R+R*cos(180-4.5*\X)},{R*sin(180-4.5*\X)},0)
arc[start angle=180-4.5*\X,end angle=180] -- (-2*R,0,h)
arc[start angle=180,end angle=180-4.5*\X] -- cycle;
\draw[fill=white,fill opacity=0.6,radius=R,3d/install view={phi=4.5*\X}]
({R+R*cos(4.5*\X)},{R*sin(4.5*\X)},0) arc[start angle=4.5*\X,end angle=0]
-- ({2*R},{0},h) arc[start angle=0,end angle=4.5*\X] -- cycle;
\fi
\end{tikzpicture}}
% final picture
\begin{tikzpicture}[pft]
\draw[fill=gray!20] (-R,0,0) arc[start angle=180,end angle=0,radius=R]
-- (R,0,h) arc[start angle=0,end angle=180,radius=R] -- cycle;
\draw[fill=white,fill opacity=0.6] (-R,0,0) arc[start angle=180,end angle=360,radius=R]
-- (R,0,h) arc[start angle=360,end angle=180,radius=R] -- cycle;
\end{tikzpicture}
\end{document}
```

This may be a start. One can define a curve for which the radius grows. In order to be sort of realistic one needs to make sure that the lenght of the curve stays fixed. For this reason I chose `r=R*exp(a*(t-t0))` so that the length can be computed analytically and inverted. It is the integral from `t_0` to `t_crit` over `sqrt(gammadot.gammadot)` where `gammadot` is the derivative of the curve w.r.t. the parameter.
```
\documentclass[tikz,border=3mm]{standalone}
\usetikzlibrary{3dtools} % https://github.com/marmotghost/tikz-3dtools
\begin{document}
\foreach \X in {1,...,50}
{\begin{tikzpicture}[3d/install view={phi=0,theta=70},
same bounding box=A,
line cap=round,line join=round,
declare function={R=2;h=4;a=0.005*\X;
reff(\t,\tmin,\a)=R*exp(\a*abs(\t-\tmin)/180);
tcrit(\tmin,\a)=\tmin+90*ln(1+\a/sqrt(1+\a*\a))/\a;}]
\draw[fill=gray!20] (-R,0,h) coordinate (D') arc[start angle=180,end angle=0,radius=R]
-- (R,0,0) arc[start angle=0,end angle=180,radius=R] -- cycle;
\pgfmathsetmacro{\tmin}{180}
\pgfmathsetmacro{\tmax}{tcrit(\tmin,a)}
\draw[smooth,fill=white,fill opacity=0.6]
plot[variable=\t,domain=\tmin:\tmax]
({reff(\t,\tmin,a)*cos(\t)},{reff(\t,\tmin,a)*sin(\t)},h) --
plot[variable=\t,domain=\tmax:\tmin]
({reff(\t,\tmin,a)*cos(\t)},{reff(\t,\tmin,a)*sin(\t)},0) -- cycle;
\pgfmathsetmacro{\tmin}{0}
\pgfmathsetmacro{\tmax}{-tcrit(\tmin,a)}
\draw[smooth,fill=white,fill opacity=0.6]
plot[variable=\t,domain=\tmin:\tmax]
({reff(\t,\tmin,a)*cos(\t)},{reff(\t,\tmin,a)*sin(\t)},h) --
plot[variable=\t,domain=\tmax:\tmin]
({reff(\t,\tmin,a)*cos(\t)},{reff(\t,\tmin,a)*sin(\t)},0) -- cycle;
\end{tikzpicture}}
\end{document}
```

As one can see there are numerical instabilities. Probably it is possible to fixe them. But this is just a start, not sure if it is a good start...