Anonymous 1123

I want to draw this pictures
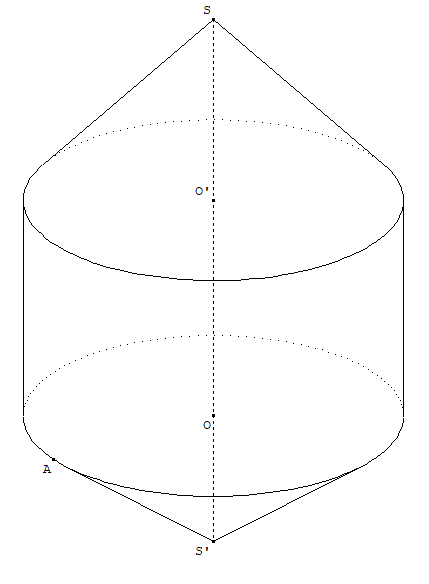
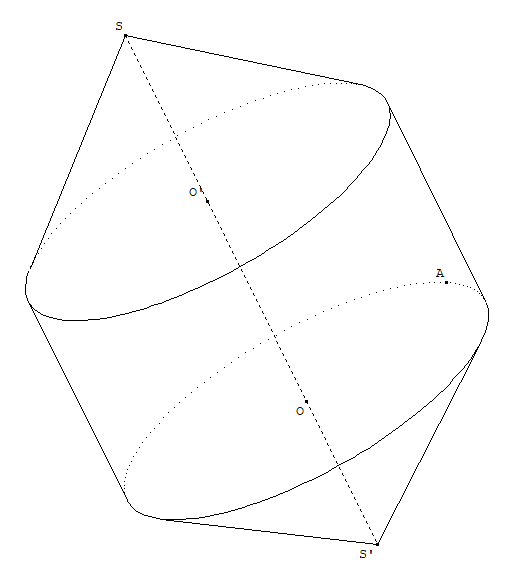
I tried
```
\documentclass[tikz,border=3mm]{standalone}
\usepackage{tikz-3dplot}
%\usetikzlibrary{intersections,calc}
\begin{document}
\pgfmathsetmacro\th{70}
\pgfmathsetmacro\az{70}
\tdplotsetmaincoords{\th}{\az}
\pgfmathsetmacro\h{3} %height of cylinder
\pgfmathsetmacro\R{3} %radius of base
\pgfmathsetmacro\v{\h + 3}
\pgfmathsetmacro\t{-\R}
\begin{tikzpicture} [scale=1, tdplot_main_coords, axis/.style={blue,thick}]
\path
(0,0,0) coordinate (O)
(0,0,\v) coordinate (B)
(0,0,\t) coordinate (A);
\pgfmathsetmacro\cott{{cot(\th)}}
\pgfmathsetmacro\fraction{\R*\cott/(\v-\h)}
\pgfmathsetmacro\fractionTwo{\R*\cott/\t}
\pgfmathsetmacro\fraction{\fraction<1 ? \fraction : 1}
\pgfmathsetmacro\angle{{acos(\fraction)}}
\pgfmathsetmacro\angleTwo{{acos(\fractionTwo)}}
\pgfmathsetmacro\PhiOne{180+(\az-90)+\angle}
\pgfmathsetmacro\PhiTwo{180+(\az-90)-\angle}
\pgfmathsetmacro\PhiOneBis{180+(\az-90)+\angleTwo}
\pgfmathsetmacro\PhiTwoBis{180+(\az-90)-\angleTwo}
\pgfmathsetmacro\sinPhiOne{{sin(\PhiOne)}}
\pgfmathsetmacro\cosPhiOne{{cos(\PhiOne)}}
\pgfmathsetmacro\sinPhiTwo{{sin(\PhiTwo)}}
\pgfmathsetmacro\cosPhiTwo{{cos(\PhiTwo)}}
\pgfmathsetmacro\sinPhiOneBis{{sin(\PhiOneBis)}}
\pgfmathsetmacro\cosPhiOneBis{{cos(\PhiOneBis)}}
\pgfmathsetmacro\sinPhiTwoBis{{sin(\PhiTwoBis)}}
\pgfmathsetmacro\cosPhiTwoBis{{cos(\PhiTwoBis)}}
\pgfmathsetmacro\sinazp{{sin(\az-90)}}
\pgfmathsetmacro\cosazp{{cos(\az-90)}}
\pgfmathsetmacro\sinazm{{sin(90-\az)}}
\pgfmathsetmacro\cosazm{{cos(90-\az)}}
\draw[dashed] (\tdplotmainphi:\R) arc(\tdplotmainphi:\tdplotmainphi+180:\R);
\draw[thick] (\tdplotmainphi:\R) arc(\tdplotmainphi:\tdplotmainphi-180:\R);
\tdplotdrawarc[tdplot_main_coords,thick]{(0,0,\h)}{\R}{\PhiOne}{360+\PhiTwo}{anchor=north}{}
\tdplotdrawarc[tdplot_main_coords,dashed]{(0,0,\h)}{\R}{\PhiTwo}{\PhiOne}{anchor=north}{}
\draw[thick] ({\R*cos(\tdplotmainphi)},{\R*sin(\tdplotmainphi)},0 ) -- ({\R*cos(\tdplotmainphi)},{\R*sin(\tdplotmainphi)},\h );
\draw[thick] ({\R*cos(\tdplotmainphi-180)},{\R*sin(\tdplotmainphi-180)},0 ) -- ({\R*cos(\tdplotmainphi-180)},{\R*sin(\tdplotmainphi-180)},\h );
\draw[thick] (B) -- (\R*\cosPhiOne,\R*\sinPhiOne,\h);
\draw[thick] (B) -- (\R*\cosPhiTwo,\R*\sinPhiTwo,\h);
\draw[thick] (A) -- (\R*\cosPhiOneBis,\R*\sinPhiOneBis,0);
\draw[thick] (A) -- (\R*\cosPhiTwoBis,\R*\sinPhiTwoBis,0);
\foreach \p in {O,B,A}
\draw[fill=black] (\p) circle (1pt);
\foreach \p/\g in {O/-45,B/90,A/-90}
\path (\p)+(\g:3mm) node{$\p$};
\draw[dashed] (A)--(B) (-\R*\sinazm,-\R*\cosazm,0) -- (-\R*\sinazp,+\R*\cosazp,0) ;
\end{tikzpicture}
\end{document}
```
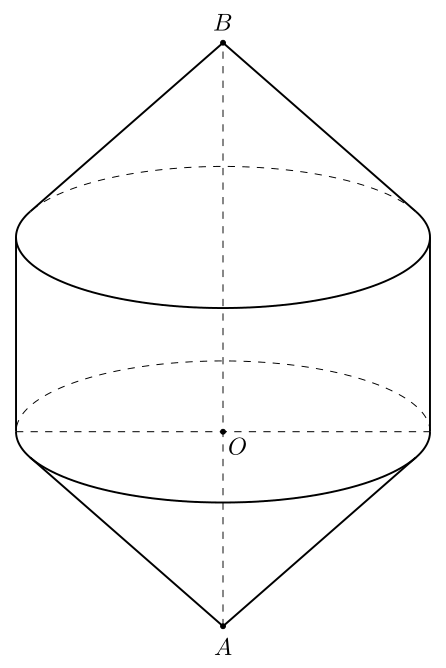
How can I draw them by using `3dtools`?