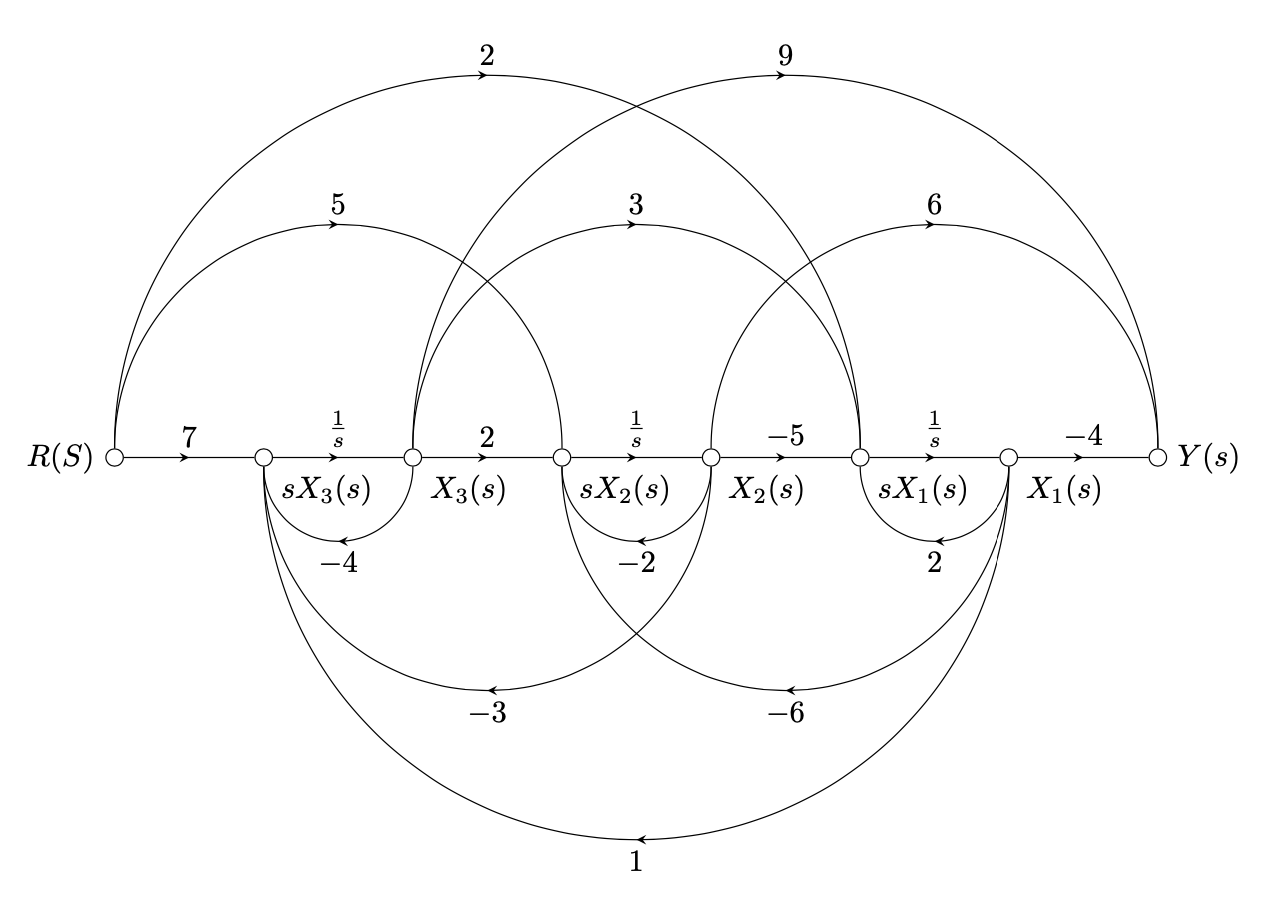
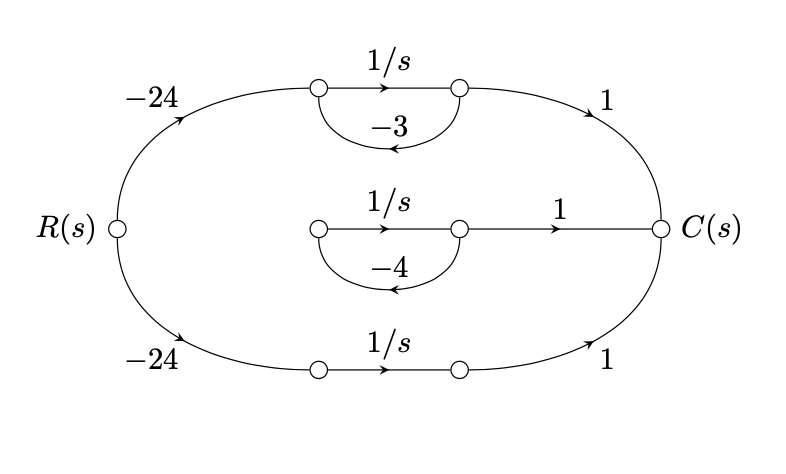
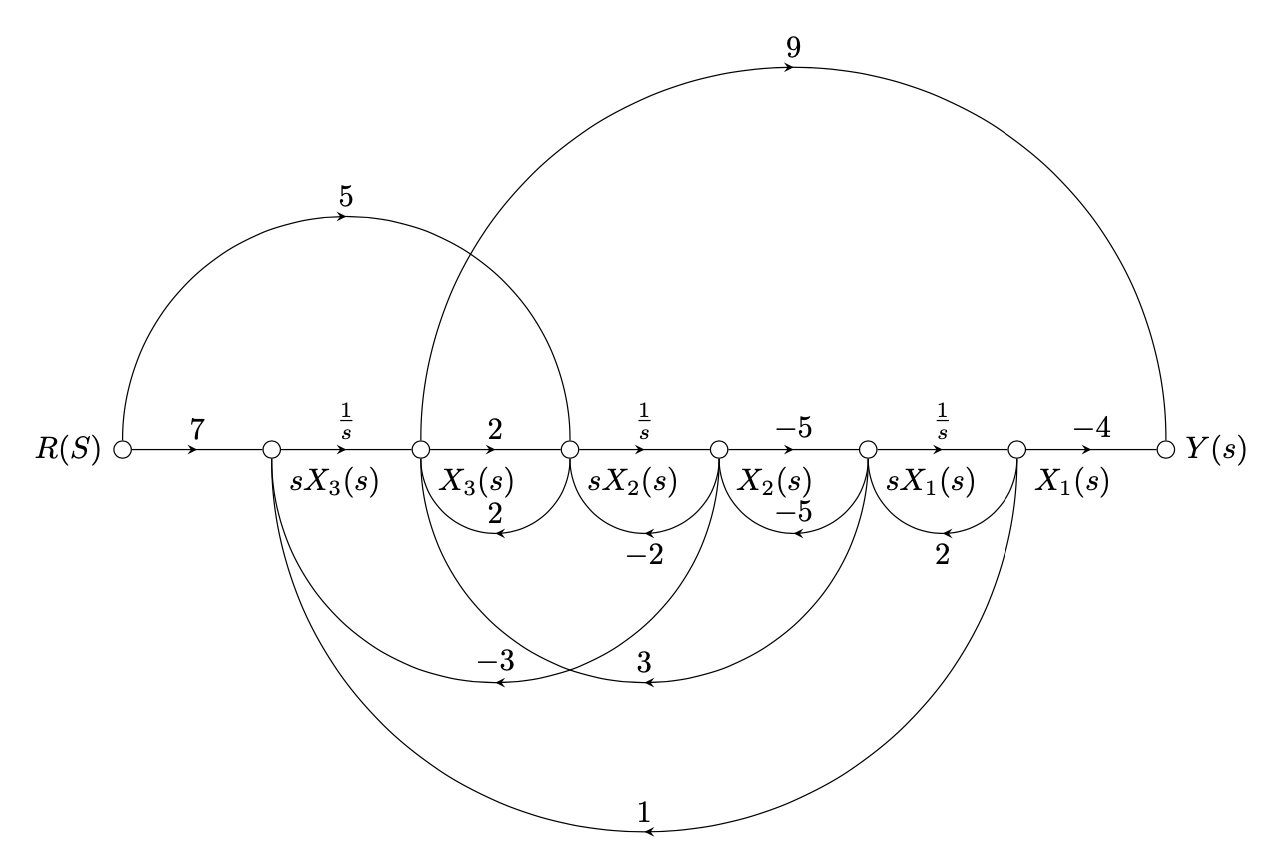
This is an answer to the updated question. It has some perhaps more powerful styles, at least when dealing with integers or numbers. Instead of trying to squeeze everything in one loop, now the strategy is to draw the horizontal part first so that all nodes on the line are defined, and then deal with the off-diagonal entries. (I sort of regret that I did not away with the `label revd`, a simple edge label would probably be better and easier to `swap`.)
```
% define the matrix
\edef\mmat{%
{2,-5,3,2},% <= a missing edge of label "3" should be drawn from X3 to sX1
{-6,-2,2,5},%
{1,-3,-4,7},%
{-4,6,9,0}%
}
\documentclass[tikz,border=5mm]{standalone}
\usetikzlibrary{calc,decorations.markings,positioning,arrows.meta}
\newif\iflabrev
\begin{document}
\begin{tikzpicture}[node distance = 15 mm,
label revd/.is if=labrev,
label revd/.default=true,
amark/.style = {
decoration={
markings,
mark=at position {0.5} with {
\arrow{stealth},
\iflabrev \node[below] {#1};\else \node[above] {#1};\fi
}
},
postaction={decorate}
}, % make the mark an entry of the \mmat matrix
pmark/.code n args={2}{%
\pgfmathtruncatemacro{\myi}{int({\mmat}[\numexpr#1][\numexpr#2])}%
\tikzset{suppress if 0=\myi,
amark={$\myi$}}% <- changed
},
terminal/.style 2 args={draw,alias=ln,circle,inner sep=2pt,label={#1:#2}},
% semicircle path
semicircle/.style={to path={let \p1=($(\tikztotarget)-(\tikztostart)$)
in \ifdim\x1>0pt
(\tikztostart.north) arc[start angle=180,end angle=0,radius=0.5*\x1]
\else
(\tikztostart.south) arc[start angle=0,end angle=-180,radius=-0.5*\x1]
\fi}},
add key if/.code n args={3}{\pgfmathtruncatemacro{\itest}{(#1?0:1)}%
\ifcase\itest
\tikzset{#2}%
\else
\tikzset{#3}%
\fi
},suppress if 0/.style={add key if={#1==0}{opacity=0}{}},
switch if/.style 2 args={}
]
\pgfmathtruncatemacro{\dimy}{dim({\mmat})} % number of rows
\pgfmathtruncatemacro{\dimx}{dim({\mmat}[0])} % number of columns
% create the graph
\path % R node
node[terminal={left}{$R(S)$},alias={X-\dimy}] (R) {}
% loop over matrix entries
foreach \Y [evaluate=\Y as \X using {int(\dimy-\Y)}]
in {1,...,\numexpr\dimy-1}
{node[right=of ln,terminal={below right}{% sX_i node
$sX_{\X}(s)$}](sX-\X){}
node[right=of ln,terminal={below right}{% X_i node
$X_{\X}(s)$}](X-\X){}
% ege from sX_i to X_i
(sX-\X) edge[amark={$\frac{1}{s}$}] (X-\X)
% edge from X_{i+1} to X_i (R had an alias)
(X-\the\numexpr\X+1) edge[pmark={\X-1}{\X},swap] (sX-\X)
% semicircle edge from X_i to sX_i
(X-\X) edge[semicircle,label revd,pmark={\X-1}{\X-1}] (sX-\X)
}
node[right=of ln,terminal={right}{$Y(s)$},alias=sX-\dimy](Y){}
(X-1) edge[pmark={\dimy-1}{0}] (Y)
% we are now done with the horizontal part,
% and have also dealt with the entries on the diagonal and
% the {i-1},i entries
% now we deal with the matrix entries
foreach \X in {1,...,\the\numexpr\dimx-1}
{ foreach \Y in {\the\numexpr\X+1,...,\dimy}
{
\unless\ifnum\X\Y=1\dimy
(X-\X) edge[semicircle,pmark={\Y-1}{\X-1},add key if={\Y==\dimy}{}{label revd}] (sX-\Y)
\fi
\unless\ifnum\numexpr\Y-\X=\numexpr1\relax
(X-\Y) edge[semicircle,pmark={\X-1}{\Y-1}] (sX-\X)
\fi
}};
\end{tikzpicture}
\end{document}
```

**Older post**: Here is something that allows you to suppress some elements of the graph conditionally. There is a more general key,
```
suppress if equal
```
which takes two arguments (which have to be expandable), and sets the opacity to zero if these arguments expand to the same value/token. Then there is a derived style
```
supress if 0
```
that takes one argument and suppresses the edge if the argument expands to `0`. This style is really just the above key with one argument set to zero, so if you have other critical values, you can construct them analogously. (Of course you can generalize the above to change e.g. the color instead of the opacity.) Note also that if you set the opacity later to some value explicitly in that edge, `suppress if 0` has to come last.
```
\documentclass[tikz,border=5mm]{standalone}
\usetikzlibrary{calc,decorations.markings,positioning,arrows.meta,matrix}
\makeatletter
\pgfmathdeclarefunction{Dim}{1}{%
\begingroup%
\pgfmath@count=0\relax
\edef\pgfutil@tmpb{#1}%
\pgfutil@for\pgfutil@tmpa:={\pgfutil@tmpb}\do{%
\advance\pgfmath@count by1\relax}%
\edef\pgfmathresult{\the\pgfmath@count}%
\pgfmath@smuggleone\pgfmathresult%
\endgroup}
\makeatother
\begin{document}
\begin{tikzpicture}[
node distance = 4em and 4em,
font=\normalsize, % https://tex.stackexchange.com/a/160987/2288
relative = false,
amark/.style = {
decoration={
markings,
mark=at position {0.5} with {
\arrow{stealth},
}
},
postaction={decorate},
nodes={inner xsep=0pt},
edge label={#1}
},
amark'/.style = {
decoration={
markings,
mark=at position {0.5} with {
\arrow{stealth},
}
},
postaction={decorate},
nodes={inner xsep=0pt},
edge label'={#1}
},
terminal/.style 2 args={draw,alias=ln,circle,inner sep=2pt},
suppress if equal/.code 2 args={\edef\mytestA{#1}%
\edef\mytestB{#2}%
\ifx\mytestA\mytestB\relax
\tikzset{opacity=0}
\fi
},suppress if 0/.style={suppress if equal={0}{#1}}
]
\def\GraphInput{-24/-3,0/-4,-24/0}
% number of insertions
\pgfmathtruncatemacro{\mydim}{Dim("\GraphInput")}
% local bounding box is a trick that all distances derive from node distance
\path[local bounding box=graph]
foreach \X/\Y [count=\Z] in \GraphInput {
% draw the inner nodes in a loop
\ifnum\Z=1
node[terminal] (sX-\Z){} node[right=of sX-\Z,terminal] (X-\Z){}
\else
node[terminal,below=of sX-\the\numexpr\Z-1] (sX-\Z){}
node[right=of sX-\Z,terminal] (X-\Z){}
\fi
}
% draw R and S nodes
node[left=6em of graph,terminal,label=left:{$R(s)$}] (R){}
node[right=6em of graph,terminal,label=right:{$C(s)$}] (C){}
% loop for connections
foreach \X/\Y [count=\Z] in \GraphInput {
% bug in pgf, out does not get parsed properly
[/utils/exec=\pgfmathsetmacro{\myout}{90-(\Z-1)*180/(\mydim-1)}]
(sX-\Z) edge[amark={$1/s$}] (X-\Z)
(X-\Z) edge[suppress if 0=\Y,amark'={$\Y$},out=-90,in=-90,looseness=1.25] (sX-\Z)
\ifnum\Z>\numexpr\mydim/2
(R) edge[amark'={$\X$},out=\myout,in=180] (sX-\Z)
(X-\Z) edge[amark'={$1$},out=0,in=180-\myout] (C)
\else
(R) edge[suppress if 0=\X,amark={$\X$},out=\myout,in=180] (sX-\Z)
(X-\Z) edge[amark={$1$},out=0,in=180-\myout] (C)
\fi
};
\end{tikzpicture}
\end{document}
```

As for the second part: is this the intended outcome?
```
% define the matrix
\edef\mmat{%
{2,-5,3,0},% <= a missing edge of label "3" should be drawn from X3 to sX1
{0,-2,2,5},%
{1,-3,0,7},%
{-4,0,9,0}%
}
\documentclass[tikz,border=5mm]{standalone}
\usetikzlibrary{calc,decorations.markings,positioning,arrows.meta}
\newif\iflabrev
\begin{document}
\begin{tikzpicture}[node distance = 15 mm,
label revd/.is if=labrev,
label revd/.default=true,
amark/.style = {
decoration={
markings,
mark=at position {0.5} with {
\arrow{stealth},
\iflabrev \node[below] {#1};\else \node[above] {#1};\fi
}
},
postaction={decorate}
}, % make the mark an entry of the \mmat matrix
pmark/.code n args={2}{%
\pgfmathtruncatemacro{\myi}{int({\mmat}[\numexpr#1][\numexpr#2])}%
\typeout{A[\the\numexpr#1,\the\numexpr#2]=\myi}
\tikzset{suppress if 0=\myi,amark={$\myi$}}% <- changed
},
terminal/.style 2 args={draw,alias=ln,circle,inner sep=2pt,label={#1:#2}},
% semicircle path
semicircle/.style={to path={let \p1=($(\tikztotarget)-(\tikztostart)$)
in \ifdim\x1>0pt
(\tikztostart.north) arc[start angle=180,end angle=0,radius=0.5*\x1]
\else
(\tikztostart.south) arc[start angle=0,end angle=-180,radius=-0.5*\x1]
\fi}},
suppress if equal/.code 2 args={\edef\mytestA{#1}%
\edef\mytestB{#2}%
\ifx\mytestA\mytestB\relax
\tikzset{opacity=0}
\fi
},suppress if 0/.style={suppress if equal={0}{#1}},
]
\pgfmathtruncatemacro{\dimy}{dim({\mmat})} % number of rows
\pgfmathtruncatemacro{\dimx}{dim({\mmat}[0])} % number of columns
% create the graph
\path % R node
node[terminal={left}{$R(S)$},alias={X-\dimy}] (R) {}
% loop over matrix entries
foreach \Y [evaluate=\Y as \X using {int(\dimy-\Y)}]
in {1,...,\numexpr\dimy-1}
{node[right=of ln,terminal={below right}{% sX_i node
$sX_{\X}(s)$}](sX-\X){}
node[right=of ln,terminal={below right}{% X_i node
$X_{\X}(s)$}](X-\X){}
% ege from sX_i to X_i
(sX-\X) edge[amark={$\frac{1}{s}$}] (X-\X)
% edge from X_{i+1} to X_i (R had an alias)
(X-\the\numexpr\X+1) edge[pmark={\X-1}{\X}] (sX-\X)
% semicircle edge from X_i to sX_i
(X-\X) edge[semicircle,label revd,pmark={\X-1}{\X-1}] (sX-\X)
% various semicircles, basically connect to all possible older ones
\ifnum\Y>1
(R) edge[semicircle,pmark={\X-1}{\dimx-1}] (sX-\X)
foreach \Z in {1,...,\numexpr\Y-1} {
(X-\X) edge[semicircle,pmark={\X+\Z-1}{\X-1}] (sX-\the\numexpr\X+\Z)
(sX-\X) edge[semicircle,pmark={\X-1}{\X+\Z-1}] (X-\the\numexpr\X+\Z)
}
\else
%(R) edge[semicircle,pmark={\X-1}{\dimx-1}] (sX-\X)
\fi
}% the Y node
node[right=of ln,terminal={right}{$Y(s)$}](Y){}
(X-1) edge[pmark={\dimy-1}{0}] (Y)
% semicircles goint to Y
foreach \Y [evaluate=\Y as \X using {int(\dimy-\Y)}]
in {1,...,\numexpr\dimy-2}
{(X-\X) edge[semicircle,pmark={\dimy-1}{\X-1}] (Y)};
\end{tikzpicture}
\end{document}
```
