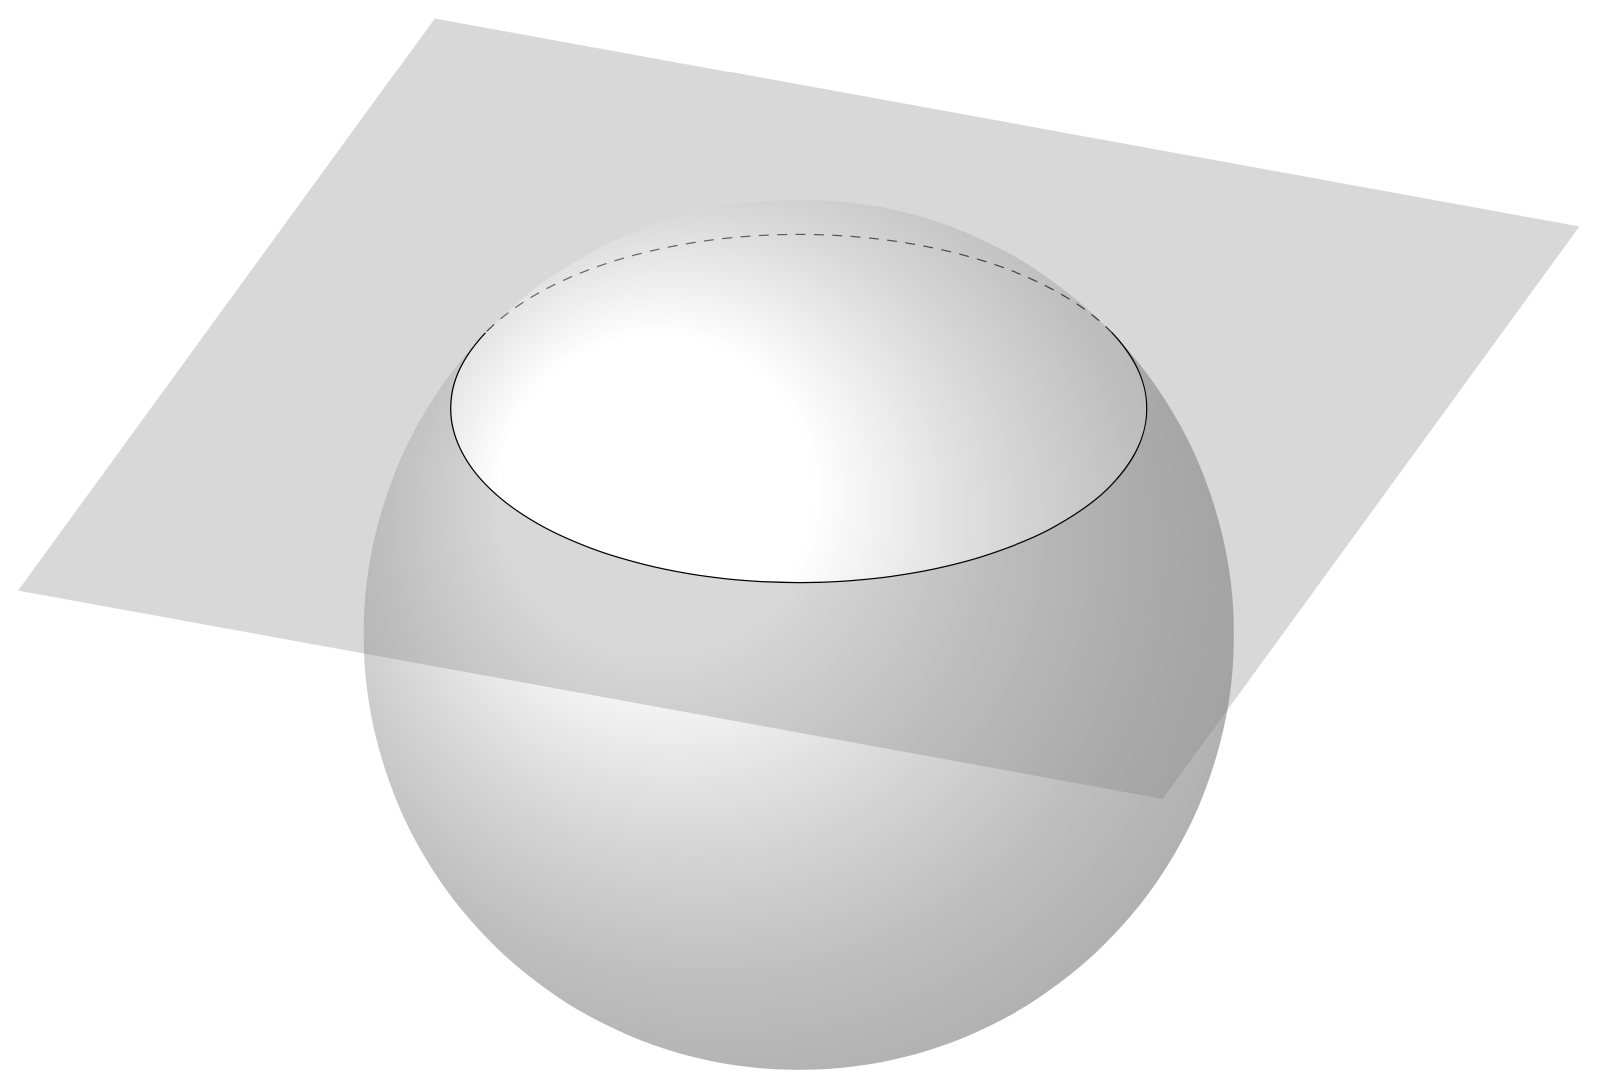
I see this question and answer [here](https://tex.stackexchange.com/questions/569452/plane-intersecting-sphere-with-tikz-and-tikz-3d). How to use with `3dtools`?
```
\documentclass{article}
\usepackage{tikz}
\usepackage{tikz-3dplot}
\usetikzlibrary{backgrounds, intersections}


%I don't have a clear idea of what is happening here, but they are used for the plane construction
\newcommand\pgfmathsinandcos[3]{%
  \pgfmathsetmacro#1{sin(#3)}%
  \pgfmathsetmacro#2{cos(#3)}%
}
\newcommand\LongitudePlane[3][current plane]{%
  \pgfmathsinandcos\sinEl\cosEl{#2} % elevation
  \pgfmathsinandcos\sint\cost{#3} % azimuth
  \tikzset{#1/.style={cm={\cost,\sint*\sinEl,0,\cosEl,(0,0)}}}
}
\newcommand\LatitudePlane[3][current plane]{%
  \pgfmathsinandcos\sinEl\cosEl{#2} % elevation
  \pgfmathsinandcos\sint\cost{#3} % latitude
  \pgfmathsetmacro\yshift{\cosEl*\sint}
  \tikzset{#1/.style={cm={\cost,0,0,\cost*\sinEl,(0,\yshift)}}} %
}
\newcommand\DrawLongitudeCircle[2][1]{
  \LongitudePlane{\angEl}{#2}
  \tikzset{current plane/.prefix style={scale=#1}}
   % angle of "visibility"
  \pgfmathsetmacro\angVis{atan(sin(#2)*cos(\angEl)/sin(\angEl))} %
  \draw[current plane] (\angVis:1) arc (\angVis:\angVis+180:1);
  \draw[current plane,dashed] (\angVis-180:1) arc (\angVis-180:\angVis:1);
}
\newcommand\DrawLatitudeCircle[2][1]{
  \LatitudePlane{\angEl}{#2}
  \tikzset{current plane/.prefix style={scale=#1}}
  \pgfmathsetmacro\sinVis{sin(#2)/cos(#2)*sin(\angEl)/cos(\angEl)}
  % angle of "visibility"
  \pgfmathsetmacro\angVis{asin(min(1,max(\sinVis,-1)))}
  \draw[current plane] (\angVis:1) arc (\angVis:-\angVis-180:1);
  \draw[current plane,dashed] (180-\angVis:1) arc (180-\angVis:\angVis:1);
}

\begin{document}

\begin{figure}
    \centering
    \tdplotsetmaincoords{60}{110}
    \begin{tikzpicture}[tdplot_main_coords,
  declare function={dicri(\t,\th,\ph,\R)=sin(\th)*sin(\ph)*(\R*cos(\t)) - sin(\th)*cos(\ph)*(\R*sin(\t))+ cos(\th)*(1);}] %dicri is defined according to a parametrization n+r*cos(t)*u+r*sen(t)*v, being u and v orthonormal vectors in the intersecting plane
  \pgfmathsetmacro{\R}{5}%
  \path  coordinate (T) at (0,0,3) %center of circle defined by the intersection
   coordinate (I) at (0,0,0);

  \path[tdplot_screen_coords,shift={(I)},use as bounding box] (-1.2*\R,-1.2*\R)rectangle (1.2*\R,1.2*\R);%this limits the image position

    %draws dot+label for coordinates T and I
    \foreach \v/\position in {T/above,I/below} {
        \draw[fill=black] (\v) circle (0.7pt) node [\position=0.2mm] {$\v$};
    }

    \begin{scope}[tdplot_screen_coords, on background layer]
        \fill[ball color=white] (I) circle[radius=\R];
        % determine the zeros of dicri
        \path[overlay,name path=dicri] plot[variable=\x,domain=0:360,samples=73]
        ({\x*1pt},{dicri(\x,\tdplotmaintheta,\tdplotmainphi,4)});
        \path[overlay,name path=zero] (0,0) -- (360pt,0);
        \path[name intersections={of=dicri and zero,total=\t}]
        let \p1=(intersection-1),\p2=(intersection-2) in
        \pgfextra{\xdef\tmin{\x1}\xdef\tmax{\x2}};
    \end{scope} %this has to do with finding the equation of the intersection circle, I believe

    \pgfmathsetmacro{\SmallR}{4} %the radius of the intersection circle is supposed as known


    % Draw continuous part of intersecting circle
    \draw[thick,save path=\pathA] plot[variable=\t,domain=\tmax:\tmin+360,samples=50,smooth]
    ({\SmallR*cos(\t)},
    {\SmallR*sin(\t)},
    {3}); %same parametrization used in dicri.

     %Plane construction
        %% some definitions
        \def\angEl{35} % elevation angle
        \def\angAz{-105} % azimuth angle
        \def\angPhi{-40} % longitude of point P
        \def\angBeta{19} % latitude of point P

        %% working planes
        \pgfmathsetmacro\H{\R*cos(\angEl)} % distance to north pole
        \tikzset{xyplane/.style={
          cm={cos(\angAz),sin(\angAz)*sin(\angEl),-sin(\angAz),cos(\angAz)*sin(\angEl),(0,-\H)}
          }, >=latex, % option for nice arrows
          inner sep=0pt,%
          outer sep=2pt,%
          mark coordinate/.style={inner sep=0pt,outer sep=0pt,minimum size=3pt,
          fill=black,circle}
        }
        \LatitudePlane[equator]{\angEl}{0}

        %% draw xy shifted plane
       \filldraw[xyplane,shift={(0,0,3)},fill=gray!20,opacity=0.4]
          (-1.8*\R,-2.6*\R) rectangle (2.2*\R,2*\R);
% added
     \clip ({\SmallR*cos(\tmax)},{\SmallR*sin(\tmax)},{3})
    coordinate (auxA)
    plot[variable=\t,domain=\tmax:\tmin+360,samples=50,smooth]
    ({\SmallR*cos(\t)},{\SmallR*sin(\t)},{3})
    coordinate (auxB) -- ($(auxB)!\R*1cm!-90:(auxA)$)
     -- ($(auxA)!\R*1cm!90:(auxB)$) -- cycle;
    \fill[ball color=white,tdplot_screen_coords] (I) circle[radius=\R];
% moved
% Draw dashed part of intersecting circle
    \draw[dashed] plot[variable=\t,domain=\tmin:\tmax,samples=50,smooth]
    ({\SmallR*cos(\t)},
    {\SmallR*sin(\t)},
    {3});
\end{tikzpicture}
\end{figure}
\end{document}
```You will need the latest version of the `3dtools` library to run the code below. For the time being I added styles that allow one to record and redraw paths, using the `show path construction` decoration from the `decorations.pathreplacing` library, which one has to load explicitly (at least at this point in time). Please note that there is a much more powerful tool in the making: [spath3](https://github.com/loopspace/spath3). "In the making" is not necessarily an adequate decription, it works beautifully, yet it does, to the best of my knowledge, currently not have the user interface that makes it easy to use for users who are not pgf and expl3 experts at the same time.
Anyway, the poor tricks here are sufficient to record the paths generated by the nice `tikz-3dplot-circleofsphere` package. So all one has to do is to use the package to construct the circle, and then a simple `even odd rule` fill to fill the plane.
```
\documentclass[tikz,border=3mm]{standalone}
\usepackage{tikz-3dplot-circleofsphere}
\usetikzlibrary{3dtools}% https://github.com/marmotghost/tikz-3dtools
\usetikzlibrary{decorations.pathreplacing}%
\begin{document}
\tdplotsetmaincoords{60}{110}
\begin{tikzpicture}[tdplot_main_coords,line join = round,
line cap = round, declare function={R=5;D=7;}]
\path (0,0,3) coordinate (T) %center of circle defined by the intersection
(0,0,0) coordinate (I);
\path [3d coordinate={(myn)=(T)-(I)}];
\begin{scope}[canvas is xy plane at z=0,shift={(T)}]
\path (D,D) coordinate (p1) (D,-D) coordinate (p2)
(-D,-D) coordinate (p3) (-D,D) coordinate (p4);
\end{scope}
\pgfmathsetmacro{\myd}{sqrt(TD("(T)-(I)o(T)-(I)"))}
\pgfmathsetmacro{\myr}{sqrt(R*R-\myd*\myd)}
\pgfmathsetmacro{\myaxisangles}{axisangles("(myn)")}
\pgfmathsetmacro{\myalpha}{{\myaxisangles}[0]}
\pgfmathsetmacro{\mybeta}{{\myaxisangles}[1]}
\pgfmathsetmacro{\mygamma}{asin(\myd/R)}
\tdplotCsDrawCircle[tdplotCsFront/.style={store path=fore},
tdplotCsBack/.style={draw,dashed}]{R}{\myalpha}{\mybeta}{\mygamma}
\begin{scope}[tdplot_screen_coords]
\shade[ball color=white,opacity=0.5] (I) circle[radius=R];
\path [stored path/first coordinate of=fore] coordinate (aux-0)
[stored path/last coordinate of=fore] coordinate (aux-1);
\fill[opacity=0.3,gray,even odd rule]
(p1) -- (p2) -- (p3) -- (p4) -- cycle
let \p0=(aux-0),\p1=(aux-1),\n0={atan2(\y0,\x0)},\n1={atan2(\y1,\x1)}
in [stored path/restore path=fore]
arc[start angle=\n1,end angle=\n0,radius=R]
-- cycle;
\draw[stored path/restore path=fore];
\end{scope}
\end{tikzpicture}
\end{document}
```

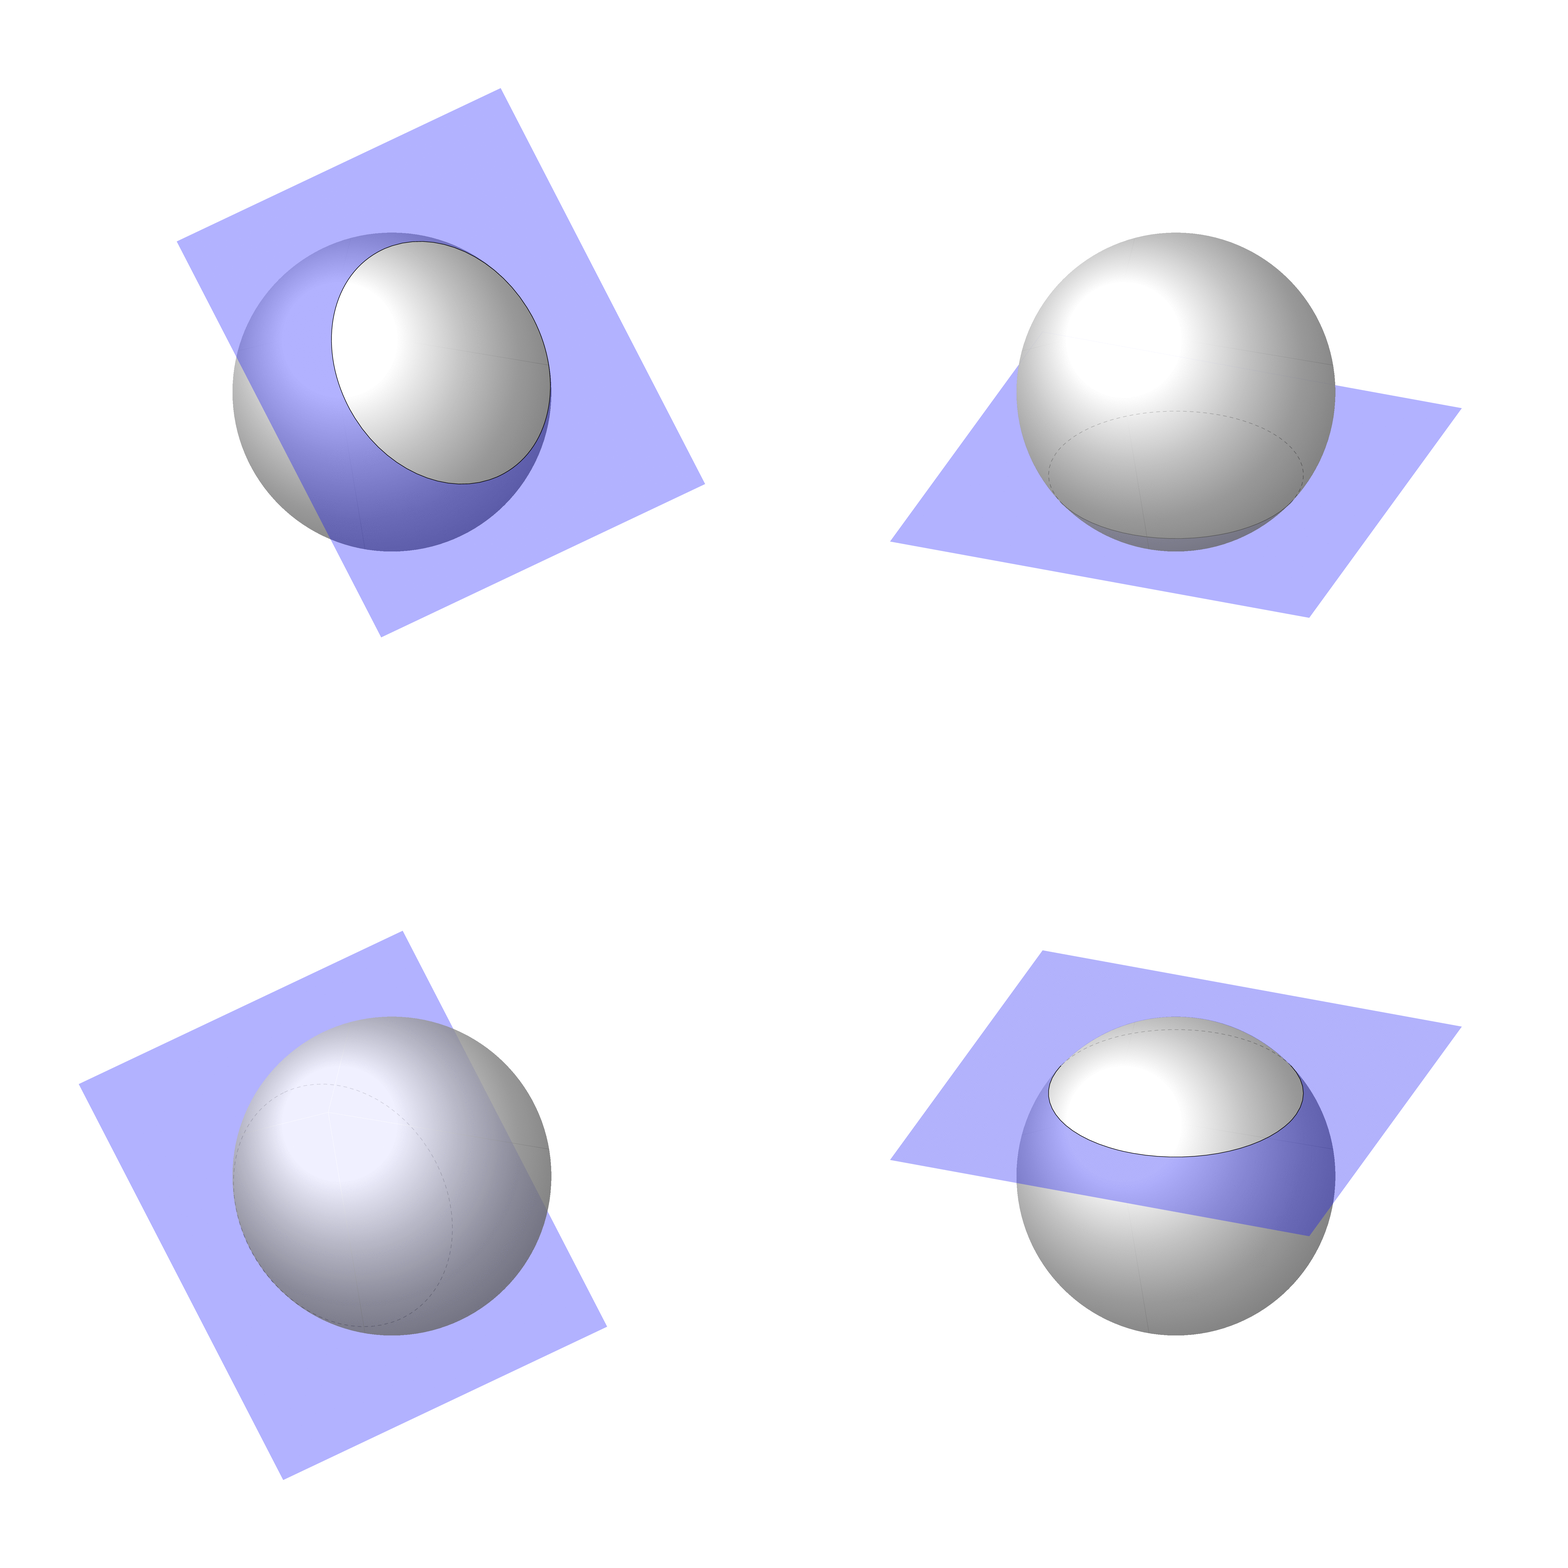
Here is an *experimental* code that is supposed to deal with arbitrary `T`.
```
\documentclass[tikz,border=3mm]{standalone}
\usepackage{tikz-3dplot-circleofsphere}
\usetikzlibrary{3dtools}% https://github.com/marmotghost/tikz-3dtools
\usetikzlibrary{decorations.pathreplacing}%
\begin{document}
\tdplotsetmaincoords{60}{110}
\foreach \mytestT in {(1,2,2),(0,0,-3),(-1,-2,-2),(0,0,3)}
{\begin{tikzpicture}[tdplot_main_coords,line join = round,
line cap = round, declare function={R=5;D=7;}]
\path \mytestT\space coordinate (T) %center of circle defined by the intersection
(0,0,0) coordinate (I);
\path [3d coordinate={(myn)=(T)-(I)}];
\pgfmathsetmacro{\myn}{TD("(myn)")}
\pgfmathsetmacro{\myd}{sqrt(TD("(myn)o(myn)"))}
\ifdim\myd pt<0.1pt
\typeout{The distance between the center of the sphere and the center of the
circle is too small. Cannot determine a unique plane.}
\else
\pgfmathsetmacro{\mynn}{1/\myd}
\pgfmathsetmacro{\myez}{TD("\mynn*(\myn)")}
\pgfmathsetmacro{\myex}{normalcandidate(\myez)}
\pgfmathsetmacro{\myey}{TD("(\myez)x(\myex)")}
\path (\myex) coordinate (ex) (\myey) coordinate (ey) (\myez) coordinate (ez);
\begin{scope}[x={(ex)},y={(ey)},z={(ez)},canvas is xy plane at z=0,shift={(T)}]
\path (D,D) coordinate (p1) (D,-D) coordinate (p2)
(-D,-D) coordinate (p3) (-D,D) coordinate (p4);
\end{scope}
\pgfmathsetmacro{\mysd}{screendepth(\myn)}
\pgfmathsetmacro{\myr}{sqrt(R*R-\myd*\myd)}
\pgfmathsetmacro{\myaxisangles}{axisangles("(myn)")}
\pgfmathsetmacro{\myalpha}{{\myaxisangles}[0]}
\pgfmathsetmacro{\mybeta}{{\myaxisangles}[1]}
\pgfmathsetmacro{\mygamma}{sign(\mysd)*asin(\myd/R)}
\tdplotCsDrawCircle[tdplotCsFront/.style={draw=none},
tdplotCsBack/.style={draw=none}]{R}{\myalpha}{\mybeta}{\mygamma}
\pgfmathsetmacro{\mydtest}{veclen(x2d("coffs")-x2d("T"),y2d("coffs")-y2d("T"))}
\ifdim\mydtest pt>2pt
\pgfmathsetmacro{\mygamma}{-1*\mygamma}
\fi
\tikzset{stored path/reset coordinate index}
\tdplotCsDrawCircle[tdplotCsFront/.style={store path=fore},
tdplotCsBack/.style={draw,dashed}]{R}{\myalpha}{\mybeta}{\mygamma}
\begin{scope}[tdplot_screen_coords]
% only for animation
\path (-R-D,-R-D) rectangle (R+D,R+D);
\tikzset{draw sphere/.code={\shade[ball color=white,opacity=0.8] (I) circle[radius=R];},
draw rest/.code={
\ifnum\np>0
\path [stored path/first coordinate of=fore] coordinate (aux-0)
[stored path/last coordinate of=fore] coordinate (aux-1);
\begin{scope}
\clip (p1) -- (p2) -- (p3) -- (p4) -- cycle;
\fill[opacity=0.3,blue,even odd rule]
(p1) -- (p2) -- (p3) -- (p4) -- cycle
let \p0=(aux-0),\p1=(aux-1),\n0={atan2(\y0,\x0)},
\n1={atan2(\y1,\x1)+(\iorder>0?0:360)}
in [stored path/restore path=fore]
arc[start angle=\n1,end angle=\n0,radius=R]
-- cycle;
\end{scope}
\draw[stored path/restore path=fore];
\else
\fill[opacity=0.3,blue,even odd rule]
(p1) -- (p2) -- (p3) -- (p4) -- cycle;
\fi
}}
\pgfmathtruncatemacro{\np}{tikztdindexoflastcoordinate}
\pgfmathtruncatemacro{\iorder}{sign(\mysd)}
\ifnum\iorder=1
\tikzset{draw sphere,draw rest}
\else
\tikzset{draw rest,draw sphere}
\fi
\end{scope}
\fi
\end{tikzpicture}}
\end{document}
```
