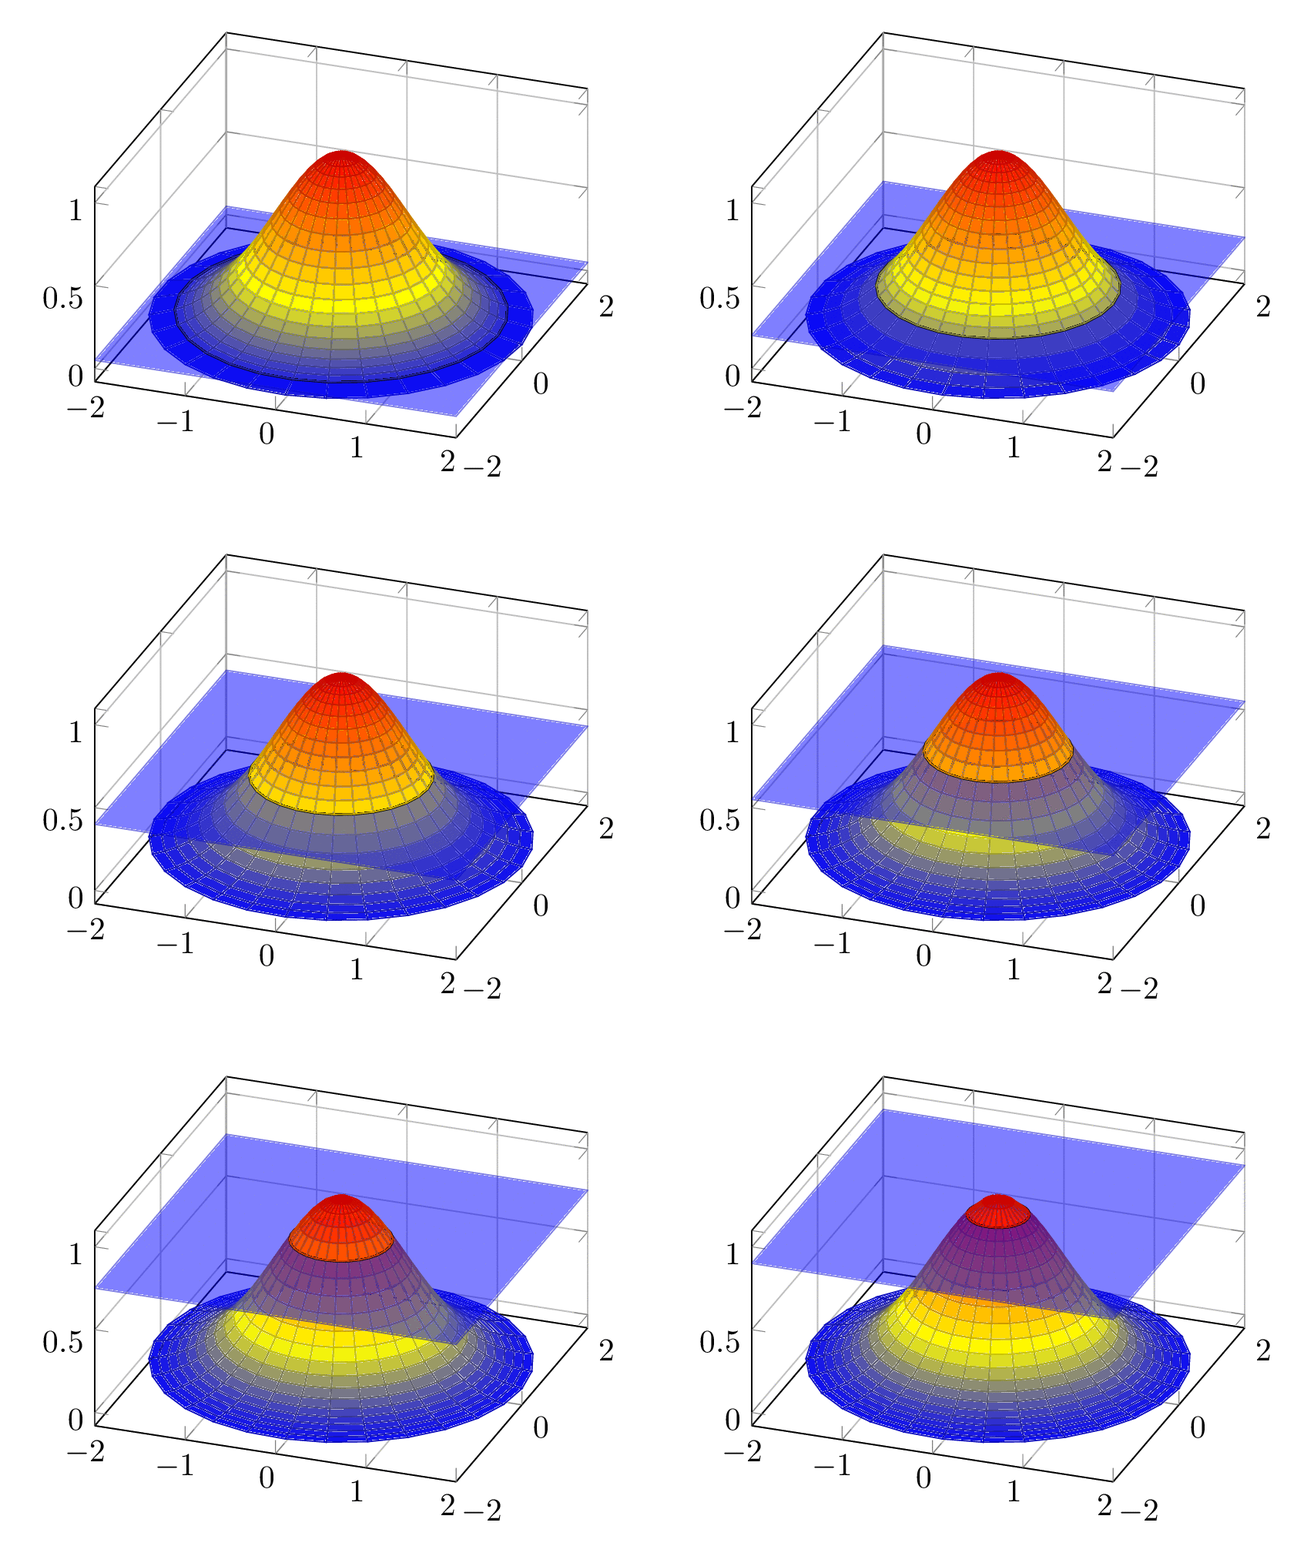
Something like this? The height of the plane is called `\X`. Then we need to invert `exp(-y^2)=\X`, the result of this exercise is called `\Z`, `\Z=sqrt(-ln(\X))`, where of course `0<\X<1`.
```
\documentclass[tikz,border=10pt]{standalone}
\usepackage{pgfplots}
\pgfplotsset{width=7cm,compat=1.16}
\begin{document}
\foreach \X [count=\Y] in {0.05,0.1,...,0.95}
{
\begin{tikzpicture}
\begin{axis}[
grid=major,view={20}{40},z buffer=sort, data cs=polar]
\pgfmathsetmacro{\Z}{sqrt(-ln(\X))}
%3D plot below plane
\addplot3 [surf, domain=0:360, domain y=\Z:2,samples=30, samples y=1+\Y]{exp(-y*y)};
%Plane
\addplot3 [data cs=cart,surf,domain=-2:2,samples=2, opacity=0.5,point meta=0]{\X};
%Plot on plane
\addplot3 [domain=0:360, samples y=0, samples=30, thick, z buffer=auto](x,\Z,\X);
%3D plot above plane
\addplot3 [surf,domain=0:360, domain y=0:\Z,samples=30, samples y=21-\Y]{exp(-y*y)};
\end{axis}
\end{tikzpicture}
}
\end{document}
```

This example exploits that function is spherically symmetric, and the function value only depends on the radial coordinate.
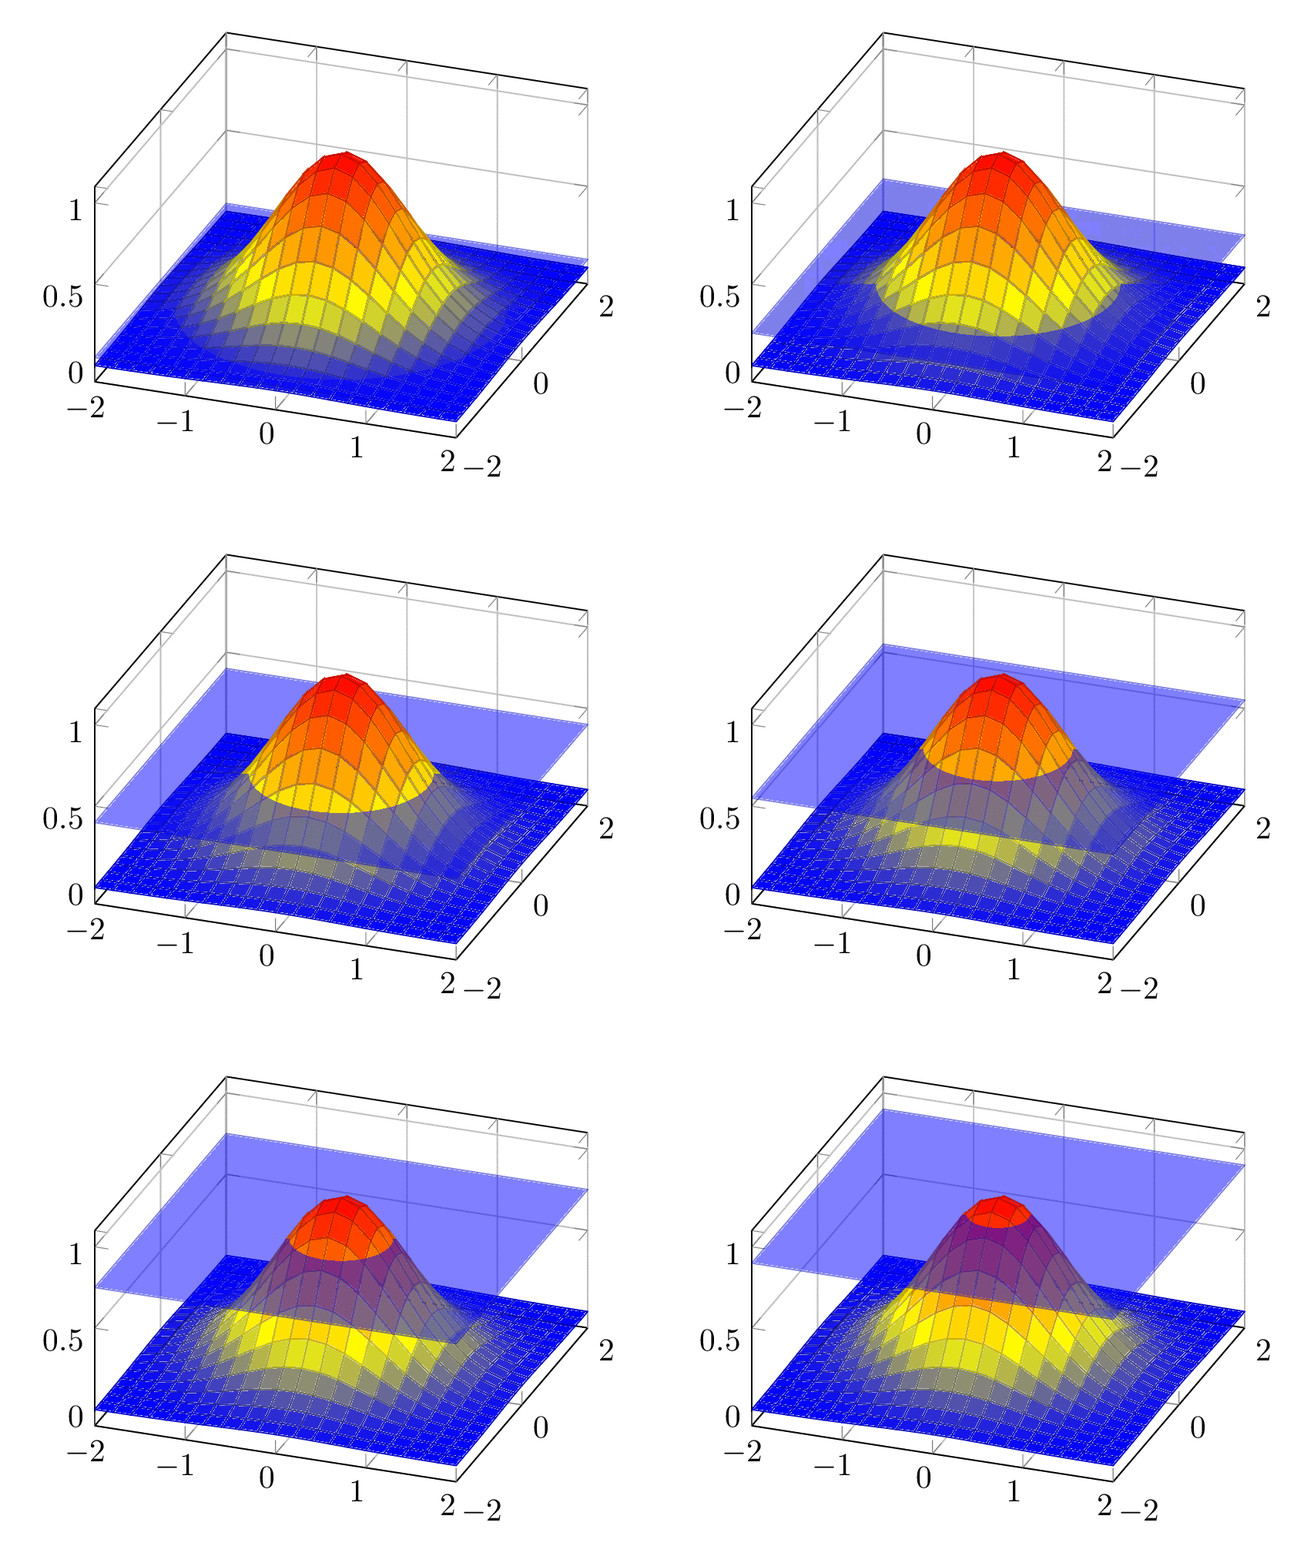
In more general situations one can work with clips. They are less general but in simple enough examples they can be made work. In this context one may employ the view parameters so that the example also works for rotated views. (In the following example there are still hard-coded values like `2` instead `xmax` but this is just to illustrate the idea.)
```
\documentclass[tikz,border=10pt]{standalone}
\usepackage{pgfplots}
\pgfplotsset{width=7cm,compat=1.16}
\begin{document}
\foreach \X [count=\Y] in {0.05,0.1,...,0.95}
{
\begin{tikzpicture}
\begin{axis}[
grid=major,view={20}{40},z buffer=sort]
\pgfmathsetmacro{\Z}{sqrt(-ln(\X))}
%3D plot below plane
\addplot3 [surf, domain=-2:2,samples=21]{exp(-y*y-x*x)};
%Plane
\addplot3 [surf,domain=-2:2,samples=2, opacity=0.5,point meta=0]{\X};
\clip
({3*cos(\pgfkeysvalueof{/pgfplots/view/az})},
{3*sin(\pgfkeysvalueof{/pgfplots/view/az})},\X)
--
({\Z*cos(\pgfkeysvalueof{/pgfplots/view/az})},
{\Z*sin(\pgfkeysvalueof{/pgfplots/view/az})},\X)
arc[start angle=\pgfkeysvalueof{/pgfplots/view/az},
end angle=\pgfkeysvalueof{/pgfplots/view/az}-180,radius=\Z]
-- ({-3*cos(\pgfkeysvalueof{/pgfplots/view/az})},
{-3*sin(\pgfkeysvalueof{/pgfplots/view/az})},\X)
-- (-2,-2,1) -- (-2,2,1) -- (2,2,1) -- cycle;
% %3D plot above plane
\addplot3 [surf, domain=-2:2,samples=21]{exp(-y*y-x*x)};
\end{axis}
\end{tikzpicture}
}
\end{document}
```
