Anonymous 1717

I have this code here to create a lean canvas:
```
\documentclass{article}
\usepackage[a1paper, landscape]{geometry}
\usepackage[UKenglish]{babel}
\pagenumbering{gobble}
\usepackage{hyperref}
\usepackage{tikz}
\title{}
\author{}
\begin{document}
\centering
\def\layersep{9.7em}
\def\layerwidth{75em}
\makebox[\textwidth][c]{
\begin{tikzpicture}[
% Define block parameters (mostly shape)
bloc/.style={
rectangle, rounded corners,
draw=black!30, very thick, inner sep=0,
},
invisible/.style={
rectangle, draw=none,
inner sep=0,
},
bloc1/.style={
bloc,
text width = \layerwidth/5*0.95,
minimum width = \layerwidth/5,
minimum height= 4*\layersep
},
bloc2/.style={
bloc,
text width = \layerwidth/5*0.95,
minimum width=\layerwidth/5,
minimum height=2*\layersep
},
bloc3/.style={
bloc,
text width=\layerwidth/2*0.95,
minimum width=\layerwidth/2,
minimum height=\layersep
},
invisible_bloc1/.style={
invisible,
text width=\layerwidth/5*0.95,
minimum width=\layerwidth/5,
minimum height=\layersep
},
invisible_bloc2/.style={
invisible,
text width=\layerwidth/5*0.95,
minimum width=\layerwidth/5,
minimum height=3*\layersep
},
title/.style={
anchor=north west,
color=black!50,
font=\bfseries
},
subtitle/.style={
anchor=north west,
color=black!50,
font=\bfseries
},
]
%%%%%%%%%%%%%%%%%%%%%%%%%
%%%% DRAW THE CANVAS %%%%
%%%%%%%%%%%%%%%%%%%%%%%%%
% first the block, then the title
% 1. PROBLEM
\node[bloc1] (b1) at (0*\layerwidth/10,4*\layersep) {};
\node[title] at (b1.north west) {\underline{Problem}};
\node[invisible_bloc2] (b11) at (0*\layerwidth/10,4.45*\layersep) {
List your top 1-3 problems.
};
% 4. SOLUTION
\node[bloc2] (b2) at (2*\layerwidth/10,5*\layersep) {
Outline a possible solution for each problem.
};
\node[title] at (b2.north west) {\underline{Solution}};
% 8. KEY METRICS
\node[bloc2] (b3) at (2*\layerwidth/10,3*\layersep) {
List the key numbers that tell you how your business is doing.
};
\node[title] at (b3.north west) {\underline{Key Metrics}};
% 7. COST STRUCTURE
\node[bloc3] (b4) at (1.5*\layerwidth/10,1.5*\layersep) {
List your fixed and variable costs.
};
\node[title] at (b4.north west) {\underline{Cost Structure}};
% 6. REVENUE STREAMS
\node[bloc3] (b5) at (6.5*\layerwidth/10,1.5*\layersep) {
List your sources of revenue.
};
\node[title] at (b5.north west) {\underline{Revenue Streams}};
% 3. UNIQUE VALUE PROPOSITIONS
\node[bloc1] (b6) at (4*\layerwidth/10,4*\layersep) {};
\node[title] at (b6.north west) {\underline{Unique Value Propositions}};
\node[invisible_bloc2] (b61) at (4*\layerwidth/10,4.45*\layersep) {
Single, clear, compelling message that states why you are different and worth paying attention.
};
% 9. UNFAIR ADVANTAGE
\node[bloc2] (b7) at (6*\layerwidth/10,5*\layersep) {
Something that cannot easily be bought or copied.
};
\node[title] at (b7.north west) {\underline{Unfair Advantage}};
% 5. CHANNELS
\node[bloc2] (b8) at (6*\layerwidth/10,3*\layersep) {
List your path to customers (inbound or outbound).
};
\node[title] at (b8.north west) {\underline{Channels}};
% 2. CUSTOMER SEGMENTS
\node[bloc1] (b9) at (8*\layerwidth/10,4*\layersep) {};
\node[title] at (b9.north west) {\underline{Customer Segments}};
\node[invisible_bloc2] (b91) at (8*\layerwidth/10,4.45*\layersep) {
List your target customers and users.
};
\end{tikzpicture}
}
\end{document}
```
I am trying to size the whole thing to fit the whole page. Also can be code be shortened? Maybe a macro to make it easier? How can I add colour to the lines and text (better UI)?
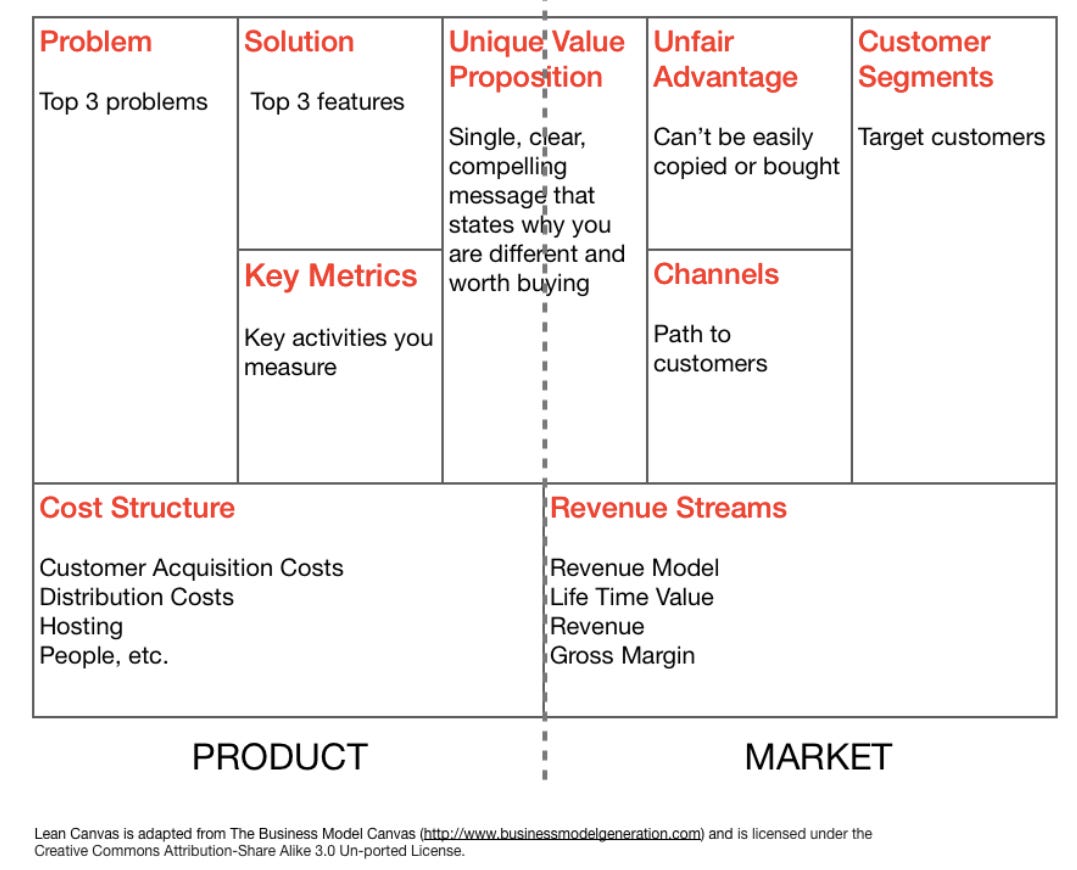
Trying to make something like this: