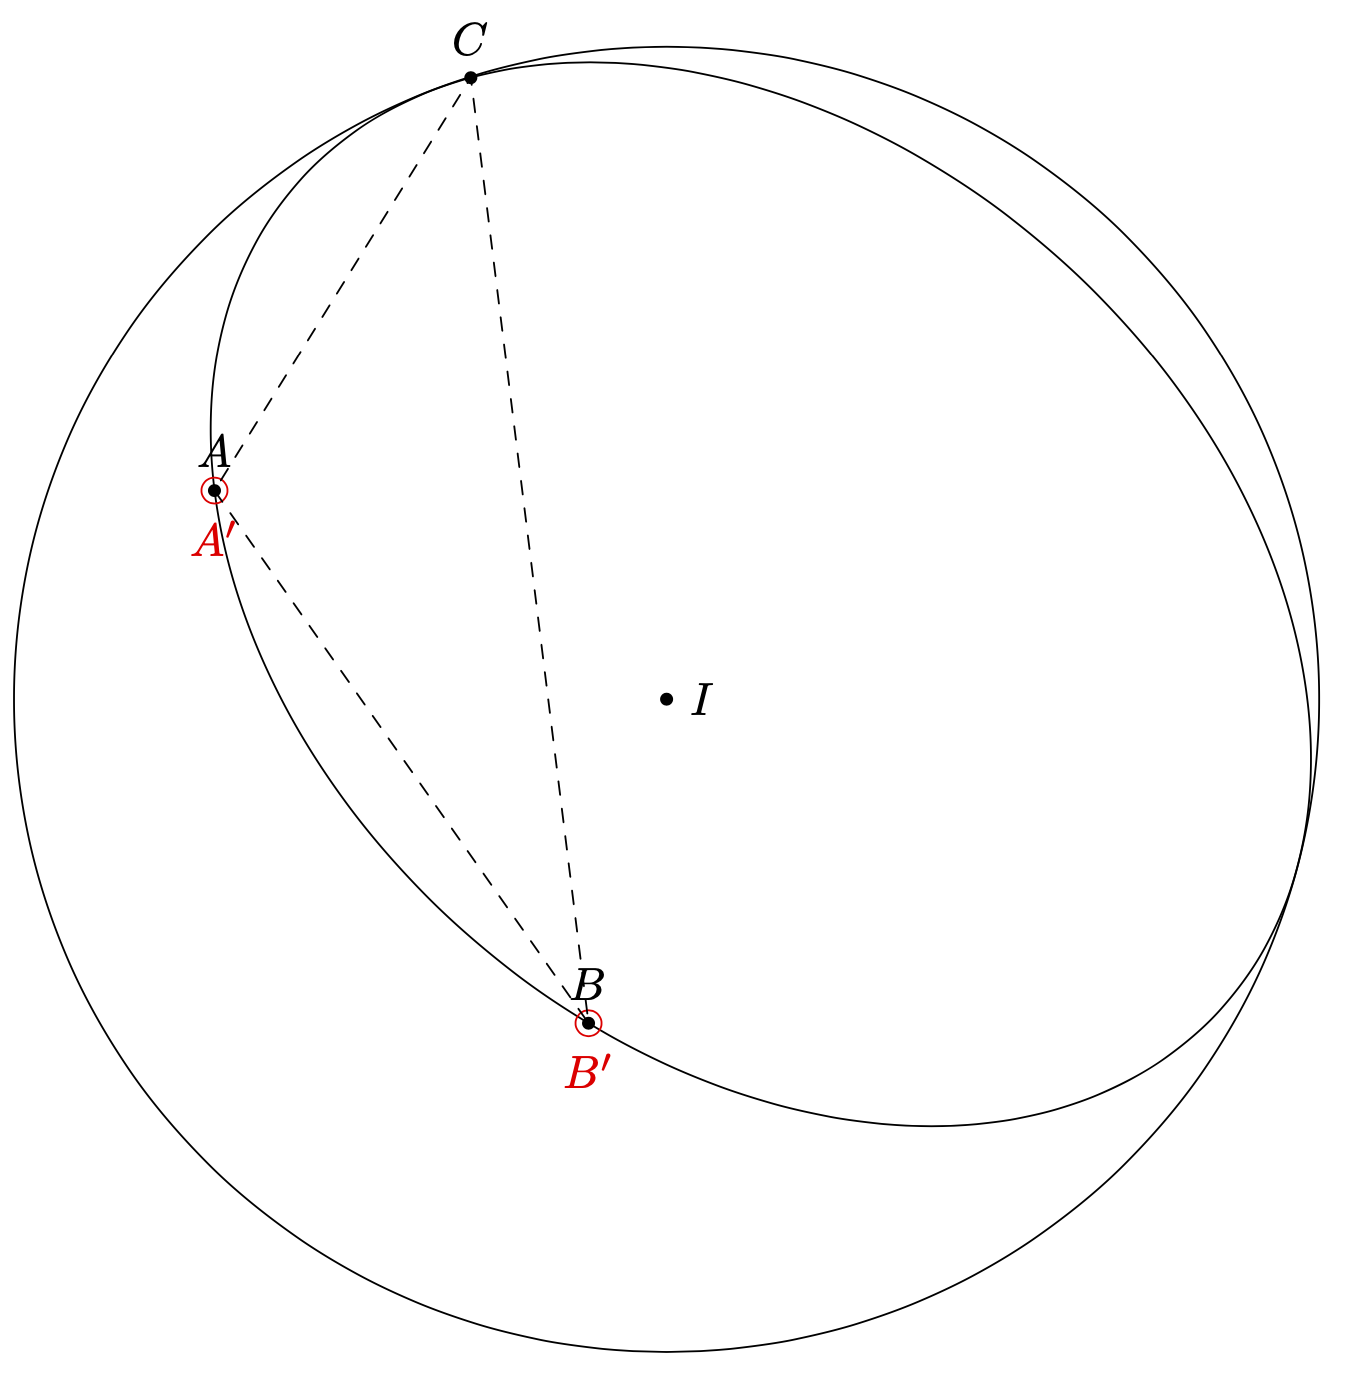
It is rather straightforward to compute the intersections. Given the line `A--B`, we project the center of the sphere, `I`, on this line to obtain `I'`. The distance `I--I'` is the distance `d` of the line from the sphere. If `d` is smaller than `R`, then there are two intersections away by `sqrt(R^2-d^2)` from `I'` on the line. This method allows one to reproduce the points `A` and `B` that you constructed to be the intersections.
```
\documentclass[border=2mm,tikz]{standalone}
\usepackage{tikz-3dplot}
\usetikzlibrary{3dtools}% https://github.com/marmotghost/tikz-3dtools
\begin{document}
\tdplotsetmaincoords{60}{150}
\begin{tikzpicture}[scale=1,tdplot_main_coords,line join = round,
line cap = round, declare function={R=5;}]
\path
(1,2,3) coordinate (I)
(5, 2, 6) coordinate (A)
(4, 6, 3) coordinate (B)
(1, -1, 7) coordinate (C);
\path[3d/line through={(A) and (B) named lAB}];
\pgfmathsetmacro{\myR}{sqrt(TD("(I)-(A)o(I)-(A)"))}
% project I on A--B
\path[3d/project={(I) on lAB}] coordinate (I');
% distance I--I'
\pgfmathsetmacro{\myD}{sqrt(TD("(I)-(I')o(I)-(I')"))}
\pgfmathtruncatemacro{\itest}{sign(R-\myD)+1}
\ifcase\itest
% no intersections
\or
% one intersection, namely I'
\or
% two intersections
% distance of intersections from I'
\pgfmathsetmacro{\myd}{sqrt(R*R-\myD*\myD)}
% normalize distance to the length of A--B
\pgfmathsetmacro{\myL}{\myd/sqrt(TD("(A)-(B)o(A)-(B)"))}
\path[3d coordinate={(A')=(I')+\myL*(A)-\myL*(B)},
3d coordinate={(B')=(I')+\myL*(B)-\myL*(A)}];
\fi
\path pic{3d circle through 3 points={A={(A)},B={(B)},C={(C)},center name=G}};
\begin{scope}[shift={(I)}]
\draw[tdplot_screen_coords] (I) circle[radius=R];
\end{scope}
\path foreach \p/\g in {I/0,A/90,B/90,C/90}
{ (\p) node[circle,fill,inner sep=1pt,label=\g:{{$\p$}}]{}};
\path[red] foreach \p/\g in {I'/0,A'/90,B'/90}
{ (\p) node[circle,draw,red,inner sep=2pt,label=180+\g:{{$\p$}}]{}};
\draw[dashed] (A) -- (B) -- (C) -- cycle;
\end{tikzpicture}
\end{document}
```
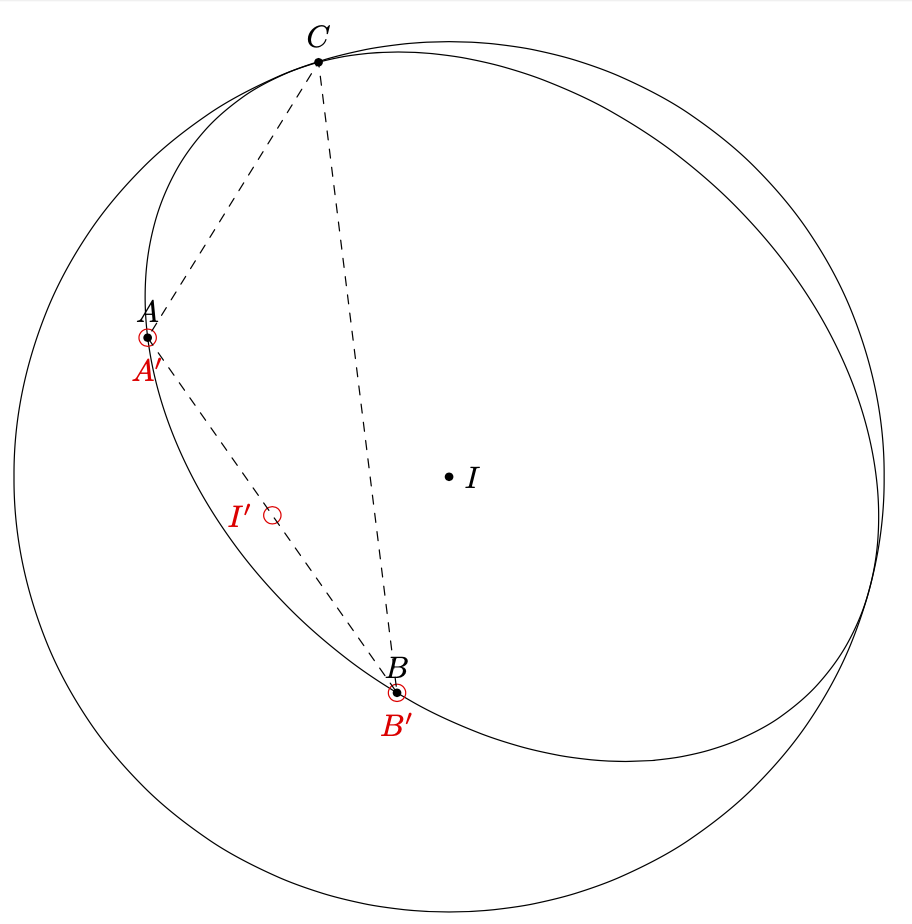
I also had a routine in the `3dtools` library but it had an error, which I fixed now, so you need to download the newest version. This tool checks if the line literally intersects. Since the points `A` and `B` just touch the sphere, we need to use a slightly longer line to be sure that the intersections can be found. (One can in principle also have a version that does not check if the intersections are contained in the interval `A--B`. For other purposes the check might be useful.)
```
\documentclass[border=2mm,tikz]{standalone}
\usepackage{tikz-3dplot}
\usetikzlibrary{3dtools} % https://github.com/marmotghost/tikz-3dtools
\begin{document}
\tdplotsetmaincoords{60}{150}
\begin{tikzpicture}[scale=1,tdplot_main_coords,line join = round,
line cap = round, declare function={R=5;}]
\path
(1,2,3) coordinate (I)
(5, 2, 6) coordinate (A)
(4, 6, 3) coordinate (B)
(1, -1, 7) coordinate (C)
% A-B=(1,-4,3)
(5.1, 1.6, 6.3) coordinate (A1)
(3.9, 6.4, 2.7) coordinate (B1) ;
\path[3d/line through={(A1) and (B1) named lAB},
3d/sphere with center={(I) and radius R named sI}];
\path[3d/aux keys/intersection 1=A',
3d/aux keys/intersection 2=B',
3d/intersection of={lAB with sI}];
\path pic{3d circle through 3 points={A={(A)},B={(B)},C={(C)},center name=G}};
\begin{scope}[shift={(I)}]
\draw[tdplot_screen_coords] (I) circle[radius=R];
\end{scope}
\path foreach \p/\g in {I/0,A/90,B/90,C/90}
{ (\p) node[circle,fill,inner sep=1pt,label=\g:{{$\p$}}]{}};
\path[red] foreach \p/\g in {A'/90,B'/90}
{ (\p) node[circle,draw,red,inner sep=2pt,label=180+\g:{{$\p$}}]{}};
\draw[dashed] (A) -- (B) -- (C) -- cycle;
\end{tikzpicture}
\end{document}
```