If I had a feature request for `tikz-3dplot-circleofsphere` then it would be the possibility to switch to Ti*k*Z styles for the circles, i.e. `insert path`, and to name the points at which the hidden curve turns visible or the visible curve turns hidden. However, as this is not possible, at least as of now, I had to hack the styles to be able to access the segments and intersection points. This allows one to draw only the visible parts of the sphere. One actually does not need all the auxiliary coordinates, all that is needed is the centers of the spheres (called `A` and `B` below) and their radii (`RA` and `RB`).
```
\documentclass[tikz,border=2mm, 12 pt]{standalone}
\usepackage{tikz-3dplot-circleofsphere}
\usetikzlibrary{3dtools}
\usetikzlibrary{decorations.pathreplacing}
\tikzset{record final point on curve as/.style={postaction={decoration={show path construction,
curveto code={
\path (\tikzinputsegmentlast) coordinate (#1);
}},decorate}}}
\makeatletter
\tikzset{reuse path/.code={\pgfsyssoftpath@setcurrentpath{#1}}}
\makeatother
\begin{document}
\tdplotsetmaincoords{70}{100}
\begin{tikzpicture}[scale=1,tdplot_main_coords,
declare function={RA=6;RB=8;}]
\path (3,2,8) coordinate (A) % radius R1
(3,-4,0) coordinate (B); % radius R
\path[overlay] [3d coordinate={(myn)=(B)-(A)}];
\pgfmathsetmacro{\myd}{sqrt(TD("(myn)o(myn)"))}
\pgfmathsetmacro{\mygammaA}{acos((RB*RB+\myd*\myd-RA*RA)/(2*RB*\myd))}
\pgfmathsetmacro{\mygammaB}{-acos((RA*RA+\myd*\myd-RB*RB)/(2*RA*\myd))}
\pgfmathsetmacro{\myaxisangles}{axisangles("(myn)")}
\pgfmathsetmacro{\myalpha}{{\myaxisangles}[0]}
\pgfmathsetmacro{\mybeta}{{\myaxisangles}[1]}
\pgfmathsetmacro{\myn}{TD("(myn)")}
\pgfmathtruncatemacro{\ltest}{(screendepth(\myn)>0?1:-1)}
\ifnum\ltest<0
\begin{scope}[shift={(B)}]
\tdplotCsDrawCircle[tdplotCsFront/.style={draw=none,save path=\pathB,record final point on curve as=aux},
tdplotCsBack/.style={draw=none,record final point on curve as=aux'}]{RB}{\myalpha}{\mybeta}{\mygammaB}
\begin{scope}[tdplot_screen_coords]
\clip let \p1=($(aux)-(B)$),\p2=($(aux')-(B)$),
\n1={atan2(\y1,\x1)},\n2={360+atan2(\y2,\x2)}
in [reuse path=\pathB] (\n1:RB) arc[start angle=\n1,end angle=\n2,radius=RB];
\fill[ball color=red,opacity=0.6] (B) circle[radius=RB];
\end{scope}
\end{scope}
\begin{scope}[shift={(A)}]
\tdplotCsDrawCircle[tdplotCsFront/.style={draw=none,save path=\pathA,record final point on curve as=aux},
tdplotCsBack/.style={draw=none,record final point on curve as=aux'}]{RA}{\myalpha}{\mybeta}{\mygammaA}
\begin{scope}[tdplot_screen_coords]
\clip let \p1=($(aux)-(A)$),\p2=($(aux')-(A)$),
\n1={360+atan2(\y1,\x1)},\n2={atan2(\y2,\x2)}
in [reuse path=\pathA] (\n1:RA) arc[start angle=\n1,end angle=\n2,radius=RA];
\fill[ball color=green!50, opacity=1.0] (A) circle[radius=RA];
\end{scope}
\end{scope}
\else
\begin{scope}[shift={(A)}]
\tdplotCsDrawCircle[tdplotCsFront/.style={draw=none,save path=\pathA,record final point on curve as=aux},
tdplotCsBack/.style={draw=none,record final point on curve as=aux'}]{RA}{\myalpha}{\mybeta}{\mygammaA}
\begin{scope}[tdplot_screen_coords]
\clip let \p1=($(aux)-(A)$),\p2=($(aux')-(A)$),
\n1={360+atan2(\y1,\x1)},\n2={atan2(\y2,\x2)}
in [reuse path=\pathA] (\n1:RA) arc[start angle=\n1,end angle=\n2,radius=RA];
\fill[ball color=green!50, opacity=1.0] (A) circle[radius=RA];
\end{scope}
\end{scope}
\begin{scope}[shift={(B)}]
\tdplotCsDrawCircle[tdplotCsFront/.style={draw=none,save path=\pathB,record final point on curve as=aux},
tdplotCsBack/.style={draw=none,record final point on curve as=aux'}]{RB}{\myalpha}{\mybeta}{\mygammaB}
\begin{scope}[tdplot_screen_coords]
\clip let \p1=($(aux)-(B)$),\p2=($(aux')-(B)$),
\n1={atan2(\y1,\x1)},\n2={360+atan2(\y2,\x2)}
in [reuse path=\pathB] (\n1:RB) arc[start angle=\n1,end angle=\n2,radius=RB];
\fill[ball color=red,opacity=0.6] (B) circle[radius=RB];
\end{scope}
\end{scope}
\fi
\foreach \p/\g in {A/90,B/-90}
{\draw[fill=black] (\p) circle[radius=1.5pt];
\path (\p)+(\g:3mm) node{$\p$};}
\end{tikzpicture}
\end{document}
```
To create the nowadays mandatory animation one has to hack even more because we do not have to clip if the intersection path is completely visible.
```
\documentclass[tikz,border=2mm, 12 pt]{standalone}
\usepackage{tikz-3dplot-circleofsphere}
\usetikzlibrary{3dtools}
\usetikzlibrary{decorations.pathreplacing}
\tikzset{record final point on curve as/.style={postaction={decoration={show path construction,
curveto code={
\path (\tikzinputsegmentlast) coordinate (#1);
}},decorate}},
memorize hidden stretch/.code={\global\tikztdhashiddenstretchtrue},
declare function={maxangle(\a,\b)=ifthenelse(abs(\b-\a)<180,\b+360,\b);}}
\makeatletter
\tikzset{reuse path/.code={\pgfsyssoftpath@setcurrentpath{#1}}}
\makeatother
\newif\iftikztdhashiddenstretch
\tikztdhashiddenstretchfalse
\begin{document}
\foreach \Angle in {5,15,...,355}
{\tdplotsetmaincoords{70}{\Angle}
\begin{tikzpicture}[scale=1,tdplot_main_coords,
declare function={RA=6;RB=8;}]
\path[use as bounding box,tdplot_screen_coords]
(-402pt,-305pt) rectangle (402pt,426pt);
\path (3,2,8) coordinate (A) % radius R1
(3,-4,0) coordinate (B); % radius R
\path[overlay] [3d coordinate={(myn)=(B)-(A)}];
\pgfmathsetmacro{\myd}{sqrt(TD("(myn)o(myn)"))}
\pgfmathsetmacro{\mygammaA}{acos((RB*RB+\myd*\myd-RA*RA)/(2*RB*\myd))}
\pgfmathsetmacro{\mygammaB}{-acos((RA*RA+\myd*\myd-RB*RB)/(2*RA*\myd))}
\pgfmathsetmacro{\myaxisangles}{axisangles("(myn)")}
\pgfmathsetmacro{\myalpha}{{\myaxisangles}[0]}
\pgfmathsetmacro{\mybeta}{{\myaxisangles}[1]}
\pgfmathsetmacro{\myn}{TD("(myn)")}
\pgfmathtruncatemacro{\ltest}{(screendepth(\myn)>0?1:-1)}
\ifnum\ltest<0
\begin{scope}[shift={(B)}]
\tikztdhashiddenstretchfalse
\tdplotCsDrawCircle[tdplotCsFront/.style={draw=none,save path=\pathB,record final point on curve as=aux},
tdplotCsBack/.style={draw=none,record final point on curve as=aux',
memorize hidden stretch}]{RB}{\myalpha}{\mybeta}{\mygammaB}
\begin{scope}[tdplot_screen_coords]
\iftikztdhashiddenstretch
\clip let \p1=($(aux)-(B)$),\p2=($(aux')-(B)$),
\n1={atan2(\y1,\x1)},\n2={maxangle(\n1,atan2(\y2,\x2))} in
[reuse path=\pathB] -- (\n1:RB) arc[start angle=\n1,end angle=\n2,radius=RB];
\fi
\fill[ball color=red,opacity=0.6] (B) circle[radius=RB];
\end{scope}
\end{scope}
\begin{scope}[shift={(A)}]
\tikztdhashiddenstretchfalse
\tdplotCsDrawCircle[tdplotCsFront/.style={draw=none,save path=\pathA,record final point on curve as=aux},
tdplotCsBack/.style={draw=none,record final point on curve as=aux',
memorize hidden stretch}]{RA}{\myalpha}{\mybeta}{\mygammaA}
\begin{scope}[tdplot_screen_coords]
\iftikztdhashiddenstretch
\clip let \p1=($(aux)-(A)$),\p2=($(aux')-(A)$),
\n1={360+atan2(\y1,\x1)},\n2={maxangle(\n1,atan2(\y2,\x2))}
in [reuse path=\pathA] (\n1:RA) arc[start angle=\n1,end angle=\n2,radius=RA];
\fi
\fill[ball color=green!50, opacity=1.0] (A) circle[radius=RA];
\end{scope}
\end{scope}
\else
\begin{scope}[shift={(A)}]
\tdplotCsDrawCircle[tdplotCsFront/.style={draw=none,save path=\pathA,record final point on curve as=aux},
tdplotCsBack/.style={draw=none,record final point on curve as=aux'}]{RA}{\myalpha}{\mybeta}{\mygammaA}
\begin{scope}[tdplot_screen_coords]
\clip let \p1=($(aux)-(A)$),\p2=($(aux')-(A)$),
\n1={360+atan2(\y1,\x1)},\n2={atan2(\y2,\x2)}
in [reuse path=\pathA] (\n1:RA) arc[start angle=\n1,end angle=\n2,radius=RA];
\fill[ball color=green!50, opacity=1.0] (A) circle[radius=RA];
\end{scope}
\end{scope}
\begin{scope}[shift={(B)}]
\tdplotCsDrawCircle[tdplotCsFront/.style={draw=none,save path=\pathB,record final point on curve as=aux},
tdplotCsBack/.style={draw=none,record final point on curve as=aux'}]{RB}{\myalpha}{\mybeta}{\mygammaB}
\begin{scope}[tdplot_screen_coords]
\clip let \p1=($(aux)-(B)$),\p2=($(aux')-(B)$),
\n1={atan2(\y1,\x1)},\n2={360+atan2(\y2,\x2)}
in [reuse path=\pathB] (\n1:RB) arc[start angle=\n1,end angle=\n2,radius=RB];
\fill[ball color=red,opacity=0.6] (B) circle[radius=RB];
\end{scope}
\end{scope}
\fi
\foreach \p/\g in {A/90,B/-90}
{\draw[fill=black] (\p) circle[radius=1.5pt];
\path (\p)+(\g:3mm) node{$\p$};}
\end{tikzpicture}}
\end{document}
```
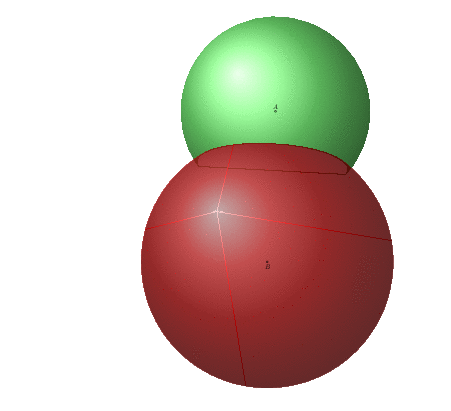
The spurious lines are due to the conversion from pdf to gif, they are absent on the pdf.