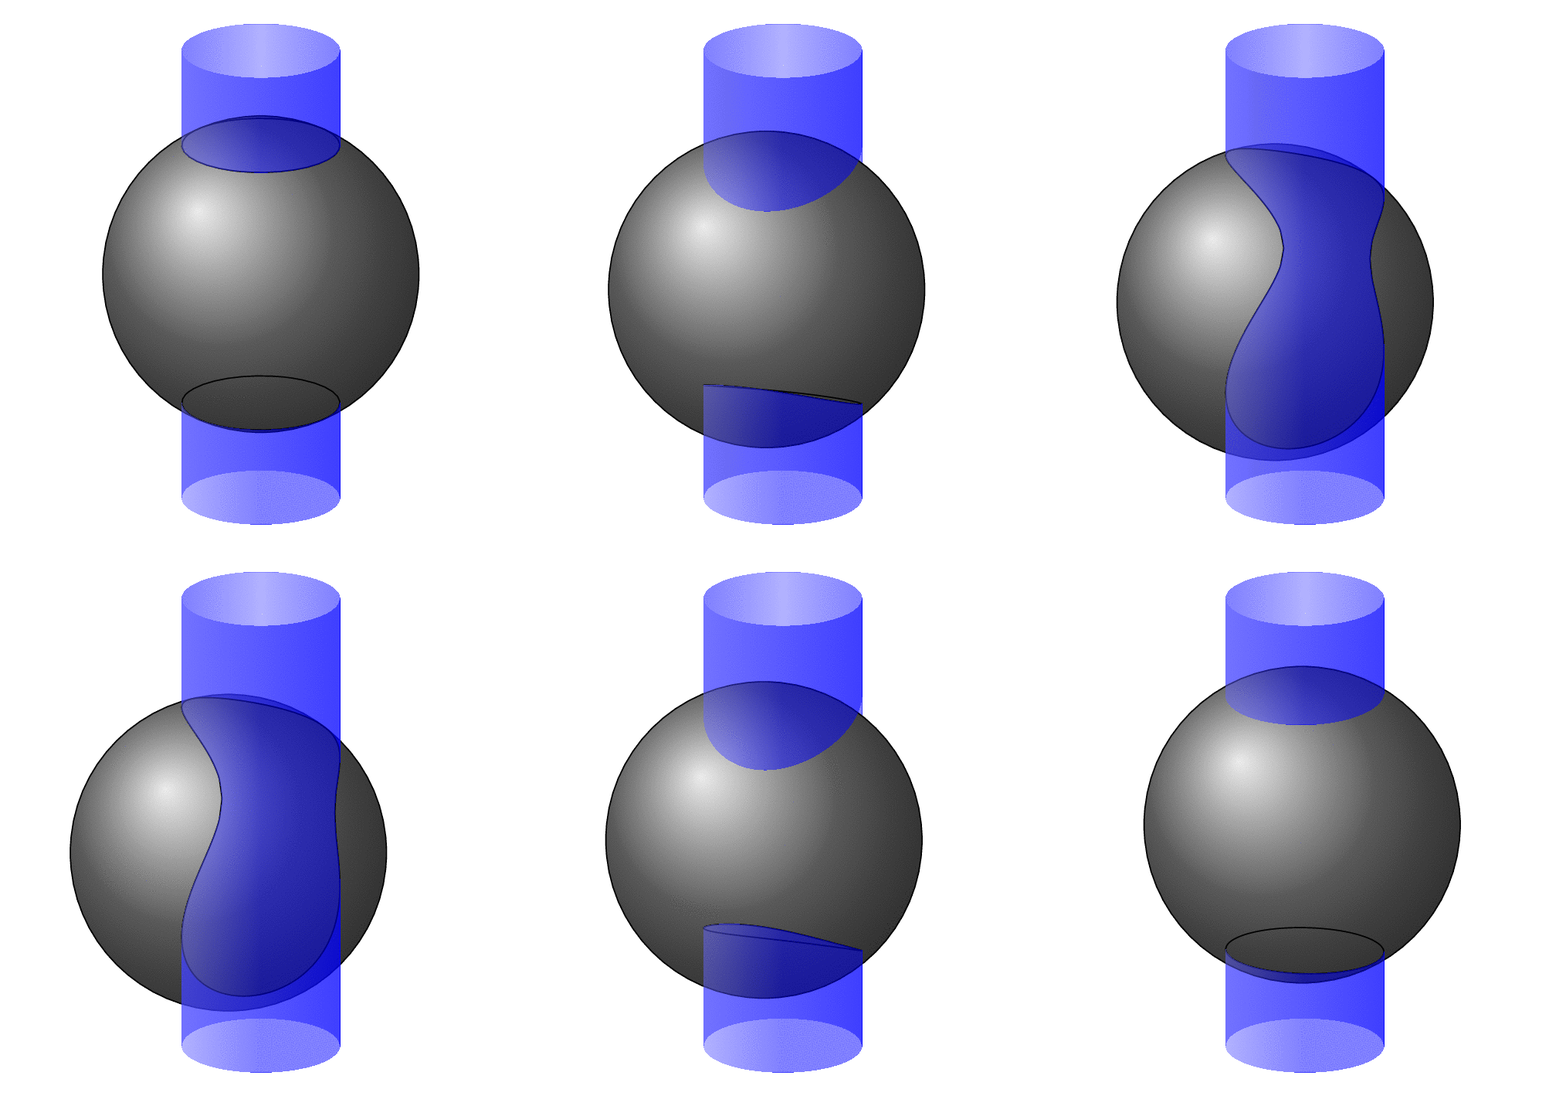
This is, at best, a start. Even though this does come even close to covering all view angles, it is a mess with many cases. The analytical formulae are derived [in Wikipedia](https://en.wikipedia.org/wiki/Sphere–cylinder_intersection). As you know from the circleofspheres packaga getting the hidden vs. visible stretches for circles on spheres right is already nontrivial, so it is not too surprising that this one is not very easy.
```
\documentclass[tikz,border=3mm]{standalone}
\usetikzlibrary{3dtools}% https://github.com/marmotghost/tikz-3dtools
\begin{document}
\foreach \mya in {0,0.1,...,1.5,1.4,1.3,...,0.1}
{\begin{tikzpicture}[line cap=round,line join=round,samples=121,
3d/install view={phi=110,psi=0,theta=70},
declare function={r=1;R=2;h=3;a=\mya;},
screen coords/.style={x={(1cm,0cm)},y={(0cm,1cm)},z={(0cm,0cm)}},
cylinder fore/.style={left color=blue!60,right color=blue,middle
color=blue,opacity=0.5,variable=\t,smooth},
fd1/.style={domain=\myphi:\myphi-180},
fd2/.style={domain=\myphi-180:\myphi},
cylinder back/.style={left color=blue,right color=blue,middle
color=blue!60,opacity=0.5,variable=\t,smooth},
bd1/.style={domain=\myphi:\myphi+180},
bd2/.style={domain=\myphi+180:\myphi},
sphere/.style={screen coords,ball color=gray}]
\path[screen coords] (-3,-3) rectangle (3,3);
\path (a,0,0) coordinate (C);
\pgfmathsetmacro{\myphi}{\pgfkeysvalueof{/tikz/3d/phi}}
\pgfmathtruncatemacro{\itest}{R+a<=r?0:1}
\unless\ifnum\itest=0
\pgfmathtruncatemacro{\itest}{a==0?1:2}
\ifnum\itest=2
\pgfmathtruncatemacro{\itest}{R>r+a?2:3}
\pgfmathsetmacro{\b}{(R*R-r*r-a*a)/2/a}
\fi
\fi
%\typeout{case \itest, a=\mya, phi=\myphi}
\ifcase\itest
% sphere inside cylinder
\draw[sphere] (C) circle[radius=R];
\or
% a=0 and R>r
\path[cylinder back] plot[bd1] ({r*cos(\t)},{r*sin(\t)},{-sqrt(R*R-r*r)})
-- plot[bd2] ({r*cos(\t)},{r*sin(\t)},{-h}) -- cycle;
\path[cylinder back] plot[bd1] ({r*cos(\t)},{r*sin(\t)},{sqrt(R*R-r*r)})
-- plot[bd2] ({r*cos(\t)},{r*sin(\t)},{h}) -- cycle;
\draw[sphere] (C) circle[radius=R];
\draw (0,0,{-sqrt(R*R-r*r)}) circle[radius=r]
(0,0,{sqrt(R*R-r*r)}) circle[radius=r];
\path[cylinder fore] plot[fd1] ({r*cos(\t)},{r*sin(\t)},{-sqrt(R*R-r*r)})
-- plot[fd2] ({r*cos(\t)},{r*sin(\t)},{-h}) -- cycle;
\path[cylinder fore] plot[fd1] ({r*cos(\t)},{r*sin(\t)},{sqrt(R*R-r*r)})
-- plot[fd2] ({r*cos(\t)},{r*sin(\t)},{h}) -- cycle;
\or
% two separate intersection curves
\path[cylinder back] plot[bd1] ({r*cos(\t)},{r*sin(\t)},{-sqrt(abs(2*a*(\b+r*cos(\t))))})
-- plot[bd2] ({r*cos(\t)},{r*sin(\t)},{-h}) -- cycle;
\path[cylinder back] plot[bd1] ({r*cos(\t)},{r*sin(\t)},{sqrt(abs(2*a*(\b+r*cos(\t))))})
-- plot[bd2] ({r*cos(\t)},{r*sin(\t)},{h}) -- cycle;
\draw[sphere] (C) circle[radius=R];
\draw plot[smooth cycle,variable=\t,domain=0:360]
({r*cos(\t)},{r*sin(\t)},{-sqrt(abs(2*a*(\b-r*cos(\t))))});
\path[cylinder fore] plot[fd1] ({r*cos(\t)},{r*sin(\t)},{-sqrt(abs(2*a*(\b-r*cos(\t))))})
-- plot[fd2] ({r*cos(\t)},{r*sin(\t)},{-h}) -- cycle;
\path[cylinder fore] plot[fd1] ({r*cos(\t)},{r*sin(\t)},{sqrt(abs(2*a*(\b-r*cos(\t))))})
-- plot[fd2] ({r*cos(\t)},{r*sin(\t)},{h}) -- cycle;
\or
% one separate intersections
\pgfmathsetmacro{\tcrit}{abs(acos(-\b/r))}
\draw[sphere] (C) circle[radius=R];
\path[cylinder back] plot[bd1,domain=\myphi:\myphi-180] ({r*cos(\t)},{r*sin(\t)},{-sqrt(abs(2*a*(\b+r*cos(\t))))})
-- plot[bd2] ({r*cos(\t)},{r*sin(\t)},{-h}) -- cycle;
\path[cylinder back] plot[bd1,domain=\myphi:\myphi-180] ({r*cos(\t)},{r*sin(\t)},{sqrt(abs(2*a*(\b+r*cos(\t))))})
-- plot[bd2] ({r*cos(\t)},{r*sin(\t)},{h}) -- cycle;
\draw plot[variable=\t,domain=-\tcrit:\tcrit,smooth]
({r*cos(\t)},{r*sin(\t)},{-sqrt(abs(2*a*(\b+r*cos(\t))))})
-- plot[variable=\t,domain=\tcrit:-\tcrit,smooth]
({r*cos(\t)},{r*sin(\t)},{sqrt(abs(2*a*(\b+r*cos(\t))))}) -- cycle;
\path[cylinder fore]
plot[variable=\t,domain=\myphi:\tcrit,smooth]
({r*cos(\t)},{r*sin(\t)},{-sqrt(abs(2*a*(\b+r*cos(\t))))})
-- plot[variable=\t,domain=\tcrit:\myphi,smooth]
({r*cos(\t)},{r*sin(\t)},{sqrt(abs(2*a*(\b+r*cos(\t))))})
-- plot[fd1] ({r*cos(\t)},{r*sin(\t)},{h})
-- plot[variable=\t,domain=\myphi+180:360-\tcrit,smooth]
({r*cos(\t)},{r*sin(\t)},{sqrt(abs(2*a*(\b+r*cos(\t))))})
-- plot[variable=\t,domain=360-\tcrit:\myphi+180,smooth]
({r*cos(\t)},{r*sin(\t)},{-sqrt(abs(2*a*(\b+r*cos(\t))))})
-- plot[fd2] ({r*cos(\t)},{r*sin(\t)},{-h}) -- cycle;
\fi
\end{tikzpicture}}
\end{document}
```
