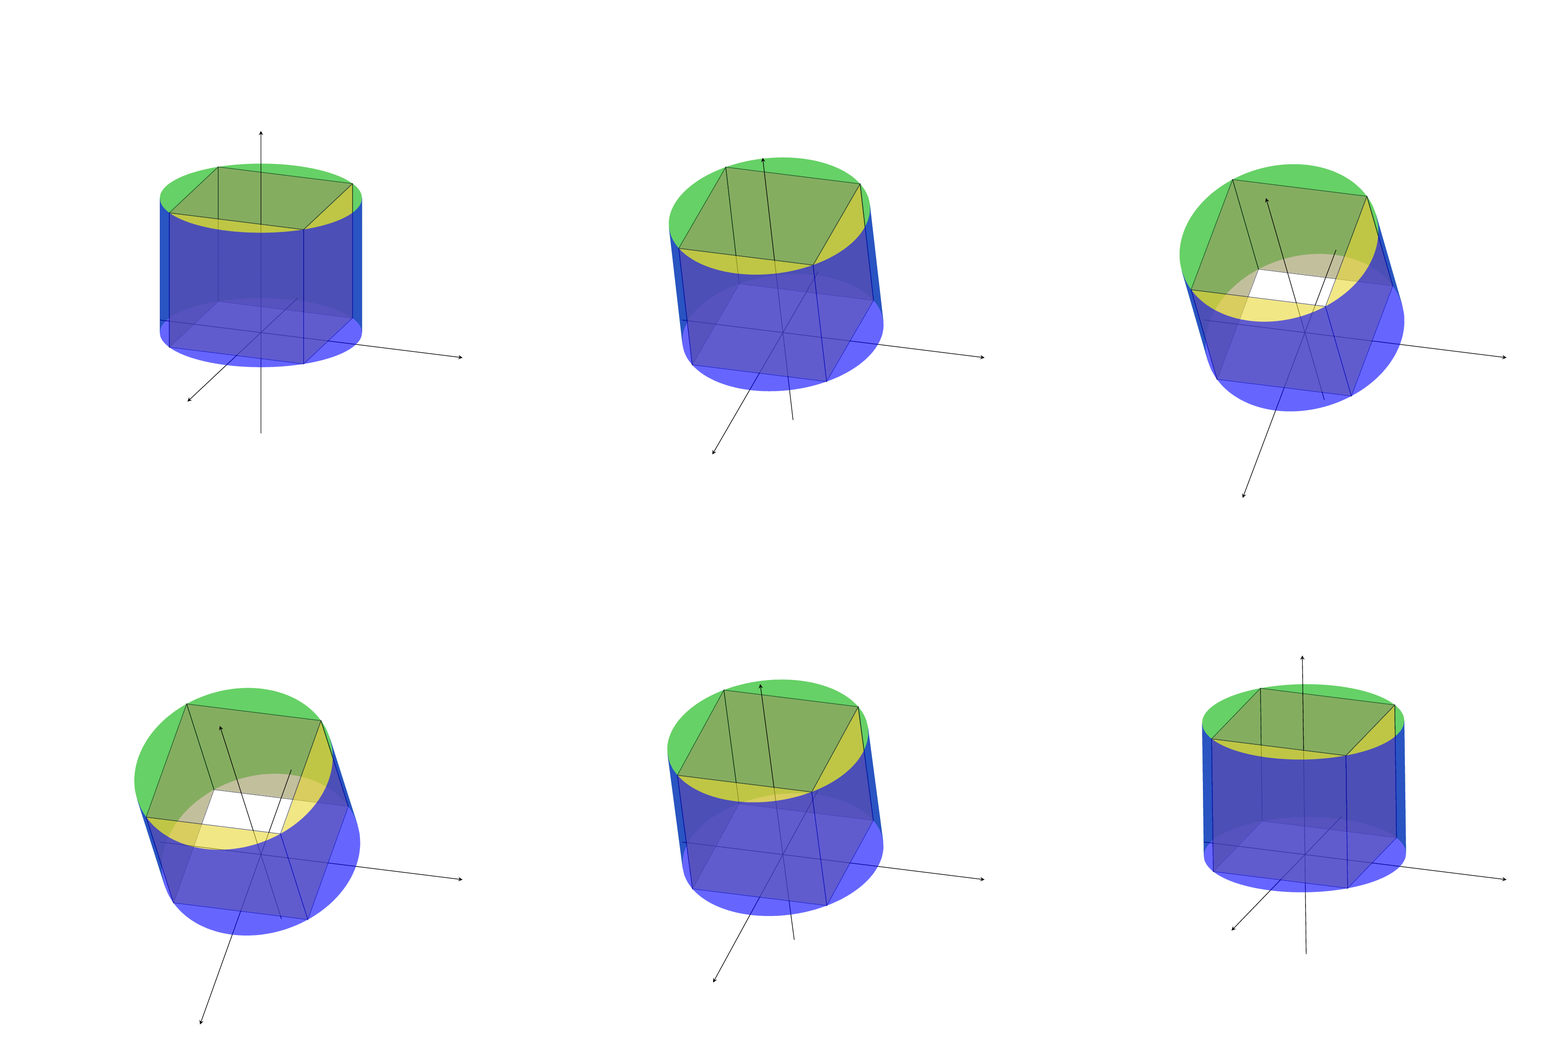
This is not my code, I copied at [here](https://www.facebook.com/groups/toanvalatex/) I do not understand all code. I do not see the author uses `\tdplotmainphi` or `\tdplotmaintheta` to draw cylinder. Is this code true?
```
\documentclass[tikz,border=5mm]{standalone}
%\usepackage{tikz}
\usepackage{tikz-3dplot}
\usepackage{ifthen}
\usetikzlibrary{shadows,calc,fadings,shadings}
\pagecolor{yellow!35}
\begin{document}
	\foreach \m in{80,79,...,31,30,31,...,80}{
		\ifthenelse{\m>30}{
			\def\l{70}
			\begin{tikzpicture}
				\tdplotsetmaincoords{\m}{70}
				\pgfmathsetmacro{\k}{\l+180}
				\clip (-6,-5)rectangle(10,10);
				\begin{scope}[line join=bevel,tdplot_main_coords]
					\clip(0,0,0)circle(9cm);
					\draw[cyan](0,0,4)circle(4);
					\tikzset{cylinder/.pic={
							\fill [samples=100,green, fill opacity = 3/5,domain=0:360]plot ({4*cos(\x)},{4*sin(\x)},0);
							\fill[orange](-4,0,0)--(0,4,0)--(4,0,0)--(4,0,0)--(0,-4,0);
						}
					}
					\path(0,0,0)pic{cylinder};
					\fill[upper right=cyan, upper left =green,lower left = cyan,lower right =green,opacity=2/5]plot [samples=100,domain={180+\k}:{360+\k}]({4*cos(\x)},{4*sin(\x)},0)--plot [samples=100,domain={360+\k}:{\k+180}]({4*cos(\x)},{4*sin(\x)},4);
					\draw[red](0,-4,0)--(0,4,0);
					\draw[red](0,4,0)--(0,8,0);
					\draw[red](-4,0,0)--(4,0,0);
					\fill[violet,opacity=0.5](-4,0,0)--(0,4,0)--(0,4,4)--(-4,0,4)--cycle;
					\draw[blue,->](0,0,4)--(0,0,8);
					\fill[red,opacity=3/4](4,0,0)--(0,4,0)--(0,4,4)--(4,0,4)--cycle;
					\fill[green,opacity=3/4](4,0,0)--(0,-4,0)--(0,-4,4)--(4,0,4)--cycle;
					\fill[yellow,opacity=3/4](0,-4,0)--(0,-4,4)--(-4,0,4)--(-4,0,0)--cycle;
					\fill[blue,opacity=3/5]plot [samples=100,domain={\k}:{180+\k}]({4*cos(\x)},{4*sin(\x)},0)--plot [samples=100,domain={180+\k}:{\k}]({4*cos(\x)},{4*sin(\x)},4);
					\draw[green](0,0,0)--(0,0,4);
					\draw[green](-4,0,4)--(4,0,4);
					\draw[green](0,-4,4)--(0,4,4)(0,0,4)circle(2pt);
					\draw[red,->](4,0,0)--(8,0,0);
					\draw[red,->](0,4,0)--(0,8,0);
				\end{scope}
		\end{tikzpicture}}
		{
			\foreach \l in{70,71,...,149,150,149,...,70}{
				\begin{tikzpicture}
					\tdplotsetmaincoords{30}{\l}
					\pgfmathsetmacro{\k}{\l+180}
					\clip (-6,-5)rectangle(10,10);
					\begin{scope}[line join=bevel,tdplot_main_coords]
						\draw[cyan](0,0,4)circle(4);
						\tikzset{cylinder/.pic={
								\fill [samples=100,green, fill opacity = 3/5,domain=0:360]plot ({4*cos(\x)},{4*sin(\x)},0);
								\fill[orange](-4,0,0)--(0,4,0)--(4,0,0)--(4,0,0)--(0,-4,0);
							}
						}
						\path(0,0,0)pic{cylinder};
						\fill[upper right=cyan, upper left =green,lower left = cyan,lower right =green,opacity=2/5]plot [samples=100,domain={180+\k}:{360+\k}]({4*cos(\x)},{4*sin(\x)},0)--plot [samples=100,domain={360+\k}:{\k+180}]({4*cos(\x)},{4*sin(\x)},4);
						\draw[red](0,-4,0)--(0,4,0);
						\draw[red](0,4,0)--(0,8,0);
						\draw[red](-4,0,0)--(4,0,0);
						\fill[violet,opacity=0.5](-4,0,0)--(0,4,0)--(0,4,4)--(-4,0,4)--cycle;
						\draw[blue,->](0,0,4)--(0,0,8);
						\fill[red,opacity=3/4](4,0,0)--(0,4,0)--(0,4,4)--(4,0,4)--cycle;
						\fill[green,opacity=3/4](4,0,0)--(0,-4,0)--(0,-4,4)--(4,0,4)--cycle;
						\fill[yellow,opacity=3/4](0,-4,0)--(0,-4,4)--(-4,0,4)--(-4,0,0)--cycle;
						\fill[blue,opacity=3/5]plot [samples=100,domain={\k}:{180+\k}]({4*cos(\x)},{4*sin(\x)},0)--plot [samples=100,domain={180+\k}:{\k}]({4*cos(\x)},{4*sin(\x)},4);
						\draw[green](0,0,0)--(0,0,4);
						\draw[green](-4,0,4)--(4,0,4);
						\draw[green](0,-4,4)--(0,4,4)(0,0,4)circle(2pt);
						\draw[red,->](4,0,0)--(8,0,0);
						\draw[red,->](0,4,0)--(0,8,0);
					\end{scope}
			\end{tikzpicture}}
		}
	}
\end{document}
```
As mentioned in the comments, the code does use `\tdplotmainphi`. However, this is actually not necessary. This answer comes with a pic that draws a cyclinder with an arbitrary axis. It also can be rotated by using rotated coordinates. It does not use `\tdplotmainphi` or `\tdplotmaintheta`. It does not rely on the specific way you installed your 3d view. The same statement applies to the polyhedron. So in order to know whether or not a code is correct it is generally not suffcient to check whether it uses certain macros.
```
\documentclass[tikz,border=3mm]{standalone}
\usepackage{tikz-3dplot}
\usetikzlibrary{3dtools}
\tikzset{pics/3d/cylinder/.style={code={
\tikzset{3d/cylinder/.cd,#1}
\def\pv##1{\pgfkeysvalueof{/tikz/3d/cylinder/##1}}%
\pgfmathsetmacro{\axisnorm}{TD("\pv{axis}o\pv{axis}")}%
\ifdim\axisnorm pt<0.01pt\relax
\typeout{Axis too short.}%
\else
\pgfmathsetmacro{\cylinderx}{TD("\pv{axis}x(nscreenx,nscreeny,nscreenz)")}%
\pgfmathsetmacro{\normcylinderx}{TD("(\cylinderx)o(\cylinderx)")}%
\ifdim\normcylinderx pt<0.005pt\relax
% cylinder axis rather parallel to normal on screen
\else
\pgfmathsetmacro{\normcylinderx}{1/sqrt(\normcylinderx)}%
\pgfmathsetmacro{\cylinderx}{TD("\normcylinderx*(\cylinderx)")}%
\pgfmathsetmacro{\cylindery}{TD("\pv{axis}x(\cylinderx)")}%
\pgfmathtruncatemacro{\itest}{screendepth(\cylindery)<0}%
\ifnum\itest=1
\pgfmathsetmacro{\cylindery}{TD("-1*(\cylindery)")}%
\fi
\pgfmathsetmacro{\axisnorm}{1/sqrt(\axisnorm)}
\pgfmathsetmacro{\cylinderz}{TD("\axisnorm*\pv{axis}")}%
\path[overlay] (\cylinderx) coordinate (cylinderx)
(\cylindery) coordinate (cylindery)
(\cylinderz) coordinate (cylinderz);
\begin{scope}[x={(cylinderx)},y={(cylindery)},z={(cylinderz)}]
\begin{pgfonlayer}{\pgfkeysvalueof{/tikz/3d/cylinder/back layer}}
\path[3d/cylinder/back]
plot[variable=\t,domain=-180:0,smooth]
({\pv{r}*cos(\t)},{\pv{r}*sin(\t)},0)
-- plot[variable=\t,domain=0:-180,smooth]
({\pv{r}*cos(\t)},{\pv{r}*sin(\t)},\pv{h}) -- cycle;
\end{pgfonlayer}
\begin{pgfonlayer}{\pgfkeysvalueof{/tikz/3d/cylinder/fore layer}}
\path[3d/cylinder/fore]
plot[variable=\t,domain=180:0,smooth]
({\pv{r}*cos(\t)},{\pv{r}*sin(\t)},0)
-- plot[variable=\t,domain=0:180,smooth]
({\pv{r}*cos(\t)},{\pv{r}*sin(\t)},\pv{h}) -- cycle;
\end{pgfonlayer}
\end{scope}
\fi
\fi
}},
3d/cylinder/.cd,r/.initial=1,h/.initial=1,
axis/.initial={(0,0,1)},
back/.style={fill=green!70!black},
fore/.style={fill=blue},
back layer/.initial={main},
fore layer/.initial={main}
}
\begin{document}
\pgfdeclarelayer{background}
\pgfdeclarelayer{foreground}
\pgfdeclarelayer{behind}
\pgfsetlayers{behind,background,main,foreground}
\foreach \Angle in {0,2,...,40,38,36,...,2}
{\tdplotsetmaincoords{70}{110}
\begin{tikzpicture}[tdplot_main_coords,
declare function={a=2;h=4;}]
\path[tdplot_screen_coords,use as bounding box]
(-7,-5) rectangle (7,9);
\tdplotsetrotatedcoords{0}{\Angle}{0}
\begin{scope}[tdplot_rotated_coords]
\path[opacity=0.5] pic{3d/cylinder={r={a*sqrt(2)},h=h,axis={(0,0,1)},
fore layer=foreground,back layer=behind,
back/.style={fill=green!70!black,opacity=0.6},
fore/.style={fill=blue,opacity=0.6}}};
\path (-a,-a,0) coordinate (A)
(a,-a,0) coordinate (B)
(a,a,0) coordinate (C)
(-a,a,0) coordinate (D)
(-a,-a,h) coordinate (A')
(a,-a,h) coordinate (B')
(a,a,h) coordinate (C')
(-a,a,h) coordinate (D')
(0,0,h/2) coordinate (I);
\draw[-stealth] (-3,0,0) -- (6,0,0);
\draw[-stealth] (0,-3,0) -- (0,6,0);
\draw[-stealth] (0,0,-3) -- (0,0,6);
\tikzset{3d/polyhedron/.cd,O={(I)},
fore/.style={opacity=0.6},fore layer=main,
back/.style={opacity=0.6},back layer=background,
draw face with corners={{(A)},{(B)},{(B')},{(A')}},
draw face with corners={{(B)},{(C)},{(C')},{(B')}},
draw face with corners={{(C)},{(D)},{(D')},{(C')}},
draw face with corners={{(D)},{(A)},{(A')},{(D')}},
};
\end{scope}
\end{tikzpicture}}
\end{document}
```
