Let me first remark that when I compile your code, on my viewer the result looks much better, i.e. one cannot really see the dashed line below the solid line. You could also try to make your solid line thicker and//or your dashed line thinner.
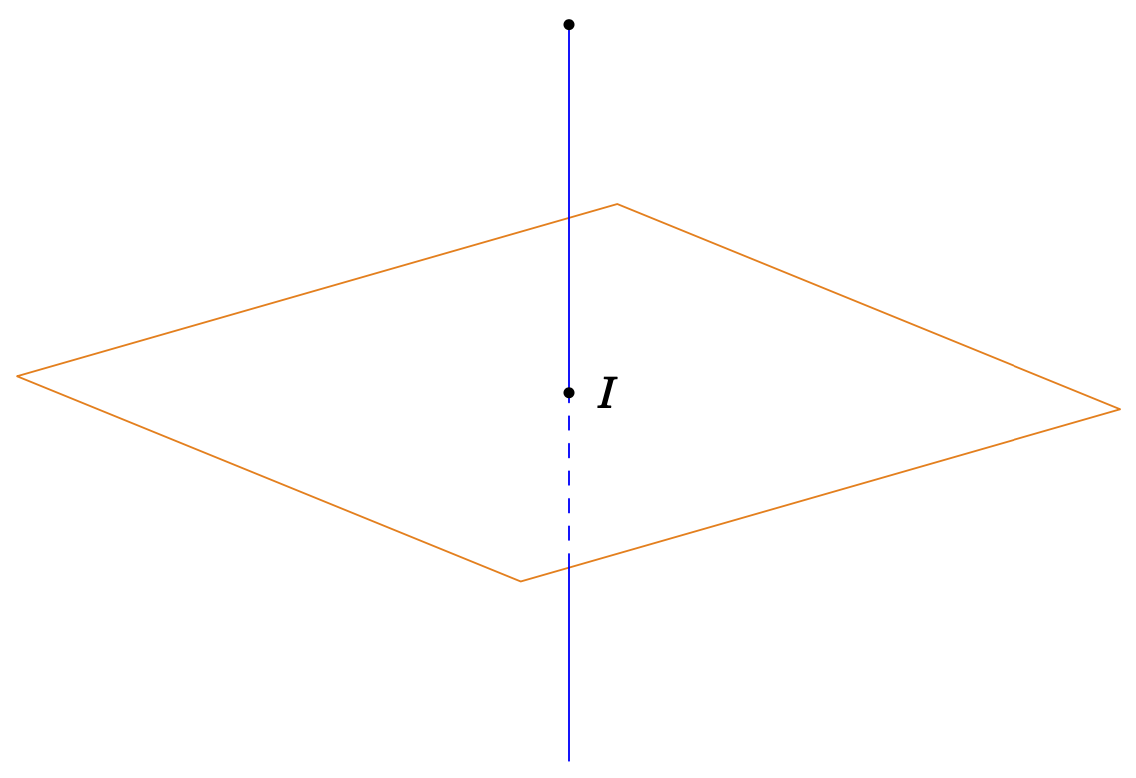
What you always can do is to draw the lines step by step.
```
\documentclass[border=2mm,tikz]{standalone}
\usepackage{tikz-3dplot}
\usepackage{fouriernc}
\usetikzlibrary{3dtools}
\makeatletter
\tikzset{
reuse path/.code={\pgfsyssoftpath@setcurrentpath{#1}}
}
\tikzset{even odd clip/.code={\pgfseteorule},
protect/.code={
\clip[overlay,even odd clip,reuse path=#1]
(-16383.99999pt,-16383.99999pt) rectangle (16383.99999pt,16383.99999pt);
}}
\makeatother
\begin{document}
\tdplotsetmaincoords{70}{50}
\begin{tikzpicture}[scale=1,tdplot_main_coords,line join = round, line cap = round, declare function={a = 3;b = 3;}]
\path
(0,0,b) coordinate (M)
(0,0,-b) coordinate (N)
(0,0,0) coordinate (O) ;
\begin{scope} [canvas is xy plane at z=0]
\draw[orange, save path=\rectA] (-a,-a) rectangle (a,a);
\end{scope}
%\draw[dashed,save path=\lineA,blue] (M) -- (N) ;
\path[3d/line through={(M) and (N) named lMN}];
\path[3d/plane with normal={(0,0,1) through (O) named plane}];
\path[overlay][3d/intersection of={lMN with plane}] coordinate (I);
\begin{scope}
\clip[reuse path=\rectA];
\draw[blue,dashed] (N) -- (I);
\end{scope}
\draw[blue] (I) -- (M);
\begin{scope}
\tikzset{protect=\rectA}
\draw[blue] (N) -- (M);
\end{scope}
\foreach \p in {I,M}
\draw[fill=black] (\p) circle (1pt);
\foreach \p/\g in {I/0}
\path (\p)+(\g:3mm) node{$\p$};
\end{tikzpicture}
\end{document}
```
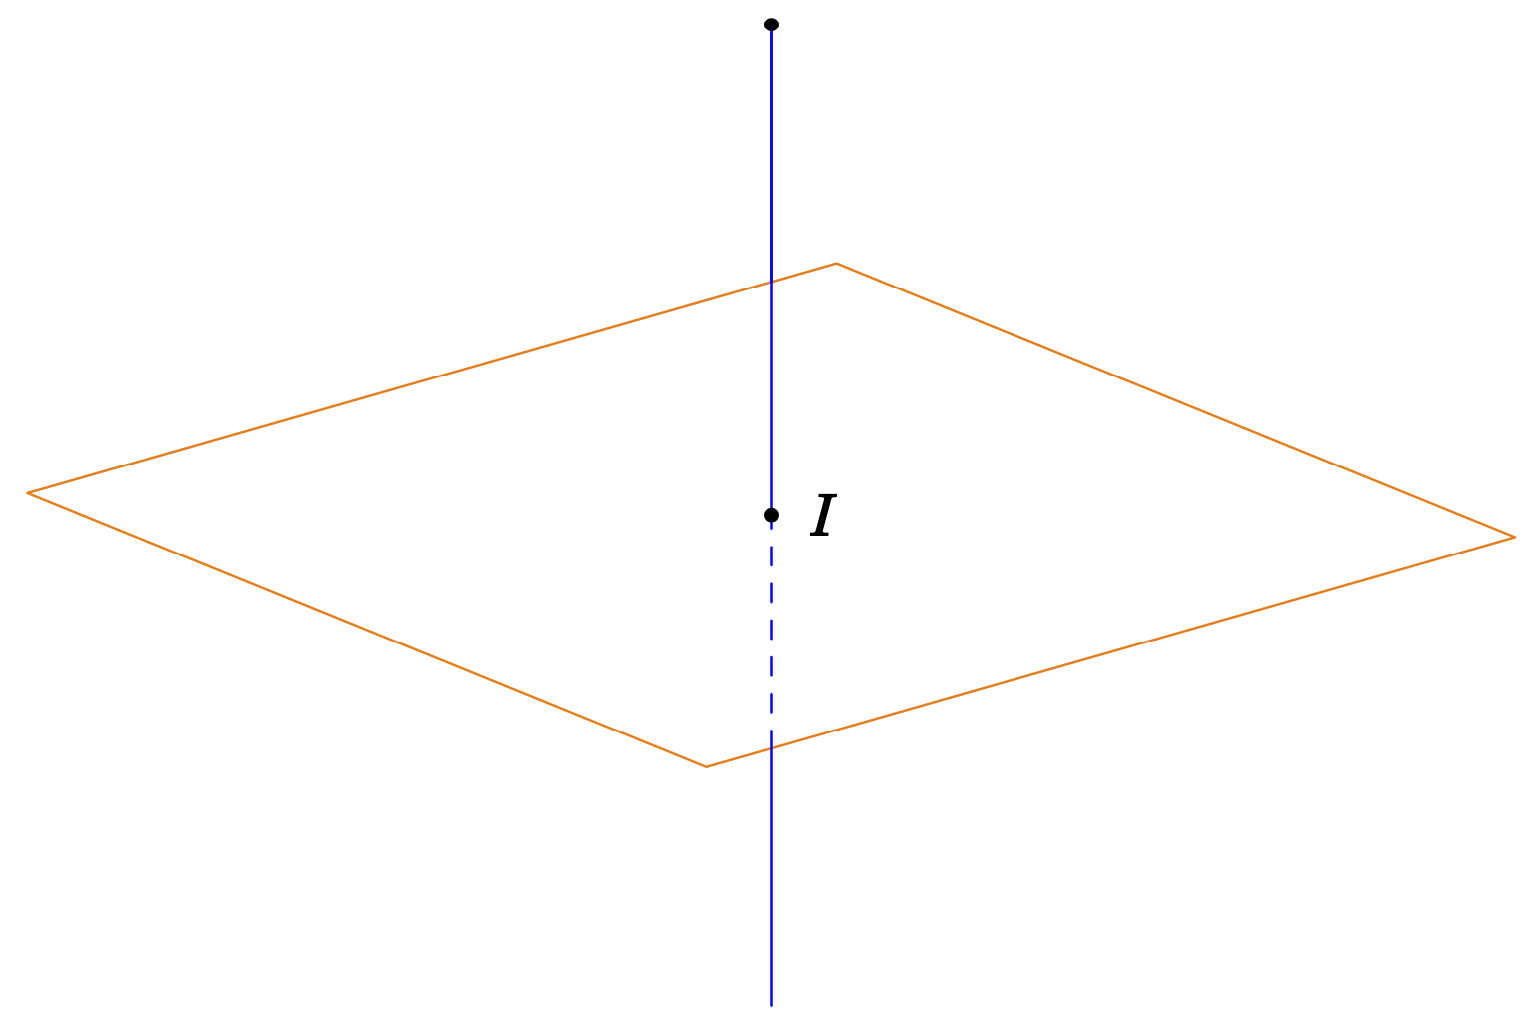
Another, arguably cleaner thing you can do is to compute the 3d coordinates of the intersections of the line and the boundaries of the plane. To be more precise, one can compute the coordinates of the points of the line that *appear* to intersect with the boundaries of the plane. This can be done by computing the 2d intersections and then reconstruct the 3d coordinates, which is rather easy for a line but harder or even impossible for general objects. For the time being I only implemented the case that the line runs through both boundaries of the plane, as in your example. There are more cases in which the line may only run through one of them, or not even reach the plane. I did not implement those, the code would become even more bulky. However, the advantage of this method is that Ti*k*Z figures out which parts are hidden and which are visible (using the `screendepth` of the reconstructed intersections).
```
\documentclass[border=2mm,tikz]{standalone}
\usepackage{tikz-3dplot}
\usepackage{fouriernc}
\usetikzlibrary{3dtools,intersections}
\begin{document}
\tdplotsetmaincoords{70}{50}
\begin{tikzpicture}[scale=1,tdplot_main_coords,line join = round, line cap = round, declare function={a = 3;b = 3;}]
\path
(0,0,b) coordinate (M)
(0,0,-b) coordinate (N)
(0,0,0) coordinate (O) ;
\path[name path=line] (M) -- (N);
\begin{scope} [canvas is xy plane at z=0]
\draw[orange, name path global=rect] (-a,-a) rectangle (a,a);
\end{scope}
\path[3d/line through={(M) and (N) named lMN}];
\path[3d/plane with normal={(0,0,1) through (O) named plane}];
\path[overlay,blue][3d/intersection of={lMN with plane}] coordinate (I)
[name intersections={of=line and rect,name={i},total=\t}]
\ifcase\t
%\pgfextra{\typeout{0 intersections.}} % not implemented
\or
%\pgfextra{\typeout{1 intersection.}} % not implemented
\or
%\pgfextra{\typeout{2 intersections.}}
let \p0=($(M)-(N)$),\p1=($(M)-(i-1)$),\p2=($(M)-(i-2)$),
\n0={veclen(\x0,\y0)},\n1={scalar(veclen(\x1,\y1)/\n0)},
\n2={scalar(veclen(\x2,\y2)/\n0)}
in [3d coordinate={(I1)=(M)+\n1*(N)-\n1*(M)},
3d coordinate={(I2)=(M)+\n2*(N)-\n2*(M)}]
\pgfextra{\pgfmathsetmacro{\myA}{TD("(I1)")}
\pgfmathsetmacro{\myB}{TD("(I)")}
\pgfmathtruncatemacro{\itest}{(screendepth(\myA)>screendepth(\myB)}}
\ifnum\itest=1
(M) edge (I) (I2) edge (N)
(I2) edge[dashed] (I)
\else
(I1) edge[dashed] (I)
(N) edge (I) (I1) edge (M)
\fi
\fi;
\foreach \p in {I,M}
{\draw[fill=black] (\p) circle (1pt);}
\foreach \p/\g in {I/0}
{\path (\p)+(\g:3mm) node{$\p$};}
\end{tikzpicture}
\end{document}
```