I'd use `pgfplots`. It may be that the documentation is a bit overwhelming when you look at it for the first time, but this is just because it has many well-documented options that one can play with.
```
\documentclass[tikz,border=3mm]{standalone}
\usepackage{pgfplots}
\pgfplotsset{compat=1.17}
\begin{document}
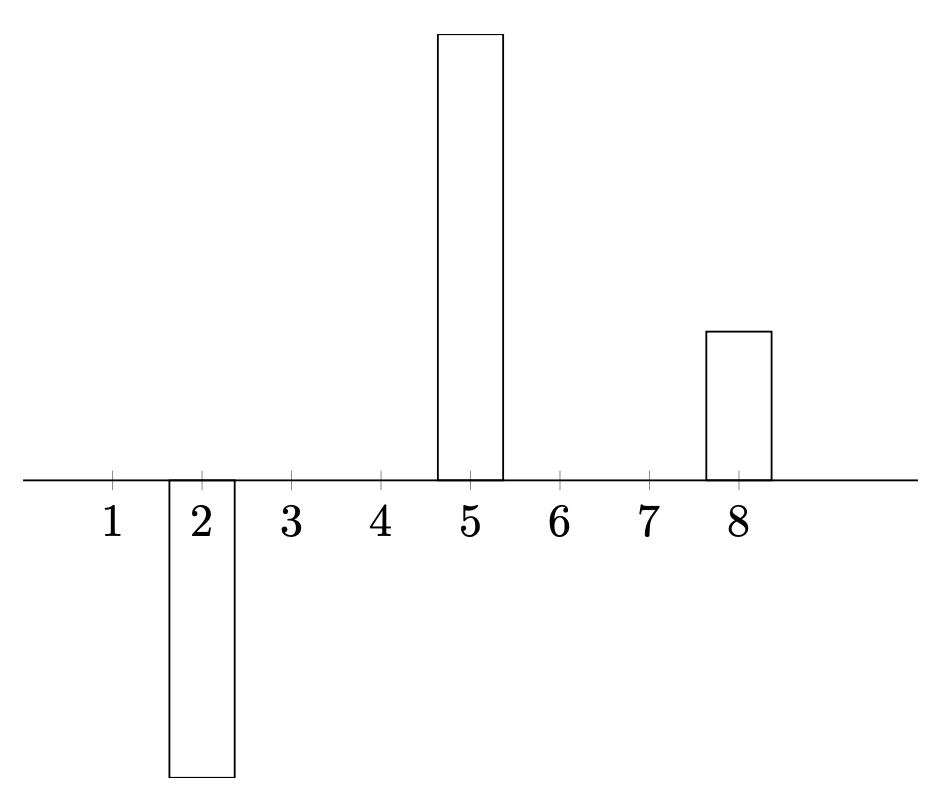
\begin{tikzpicture}
\begin{axis}[ybar,bar width=5mm,
axis lines=middle,
xmin=0,xmax=10,
xtick={1,...,8},ytick=\empty,
x axis line style={-},
y axis line style={draw=none}]
\addplot[fill=none] coordinates {(2,-2) (5,3) (8,1)};
\end{axis}
\end{tikzpicture}
\end{document}
```
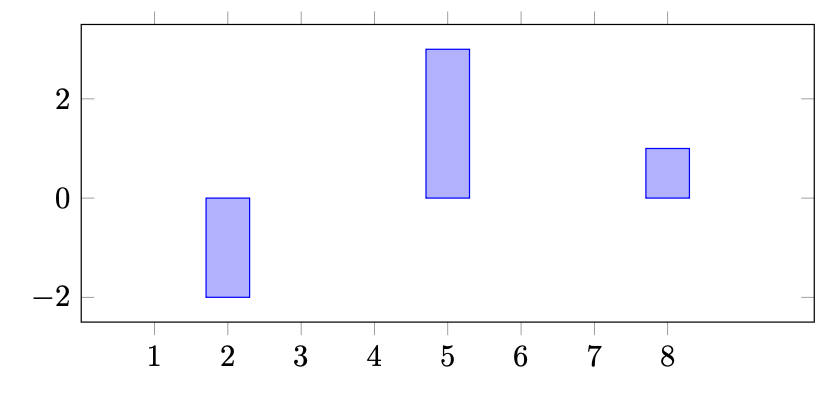
There are many things you could change. You could fill the bars, plot the data directly from a file and so on and so on.
```
\documentclass[tikz,border=3mm]{standalone}
\usepackage{pgfplots}
\pgfplotsset{compat=1.17}
\begin{filecontents}[overwrite]{mybars.dat}
x y
2 -2
5 3
8 1
\end{filecontents}
\begin{document}
\begin{tikzpicture}
\begin{axis}[ybar,
width=10cm,height=5cm,bar width=5mm,
xmin=0,xmax=10,
xtick={1,...,8}]
\addplot table {mybars.dat};
\end{axis}
\end{tikzpicture}
\end{document}
```
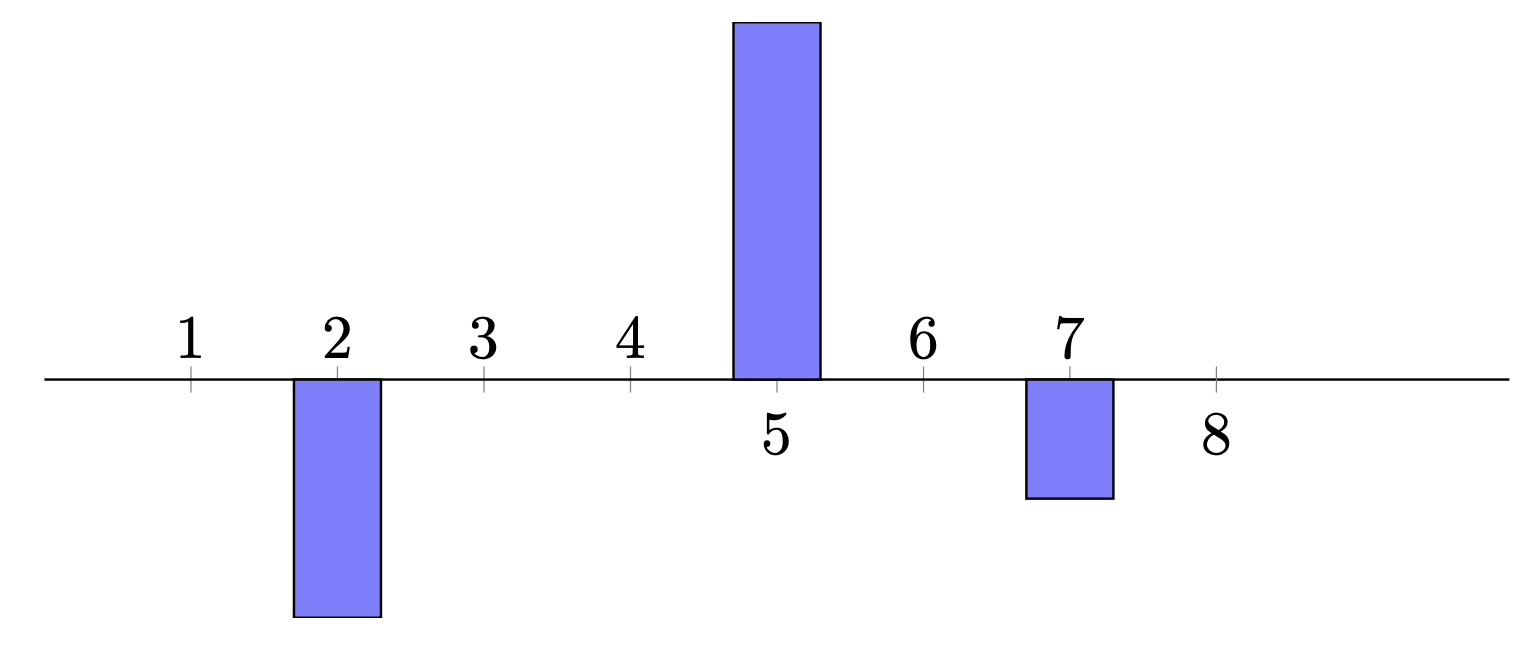
You can change the tick labels at will. Here I show two methods, there are alternatives which play more with `xtricklabel` but may be considered "hacky" and other alternatives.
```
\documentclass[tikz,border=3mm]{standalone}
\usepackage{pgfplots}
\pgfplotsset{compat=1.17}
\begin{document}
\begin{tikzpicture}
\begin{axis}[ybar,bar width=5mm,
width=10cm,height=5cm,
axis lines=middle,
xmin=0,xmax=10,
xtick={1,...,4,6,7},
xticklabel style={anchor=south,text depth=0.5ex},
extra x ticks={5,8},
extra x tick style={xticklabel style={anchor=north}},
ytick=\empty,
x axis line style={-},
y axis line style={draw=none}]
\addplot[fill=blue!50!white] coordinates {(2,-2) (5,3) (7,-1)};
\end{axis}
\end{tikzpicture}
\end{document}
```