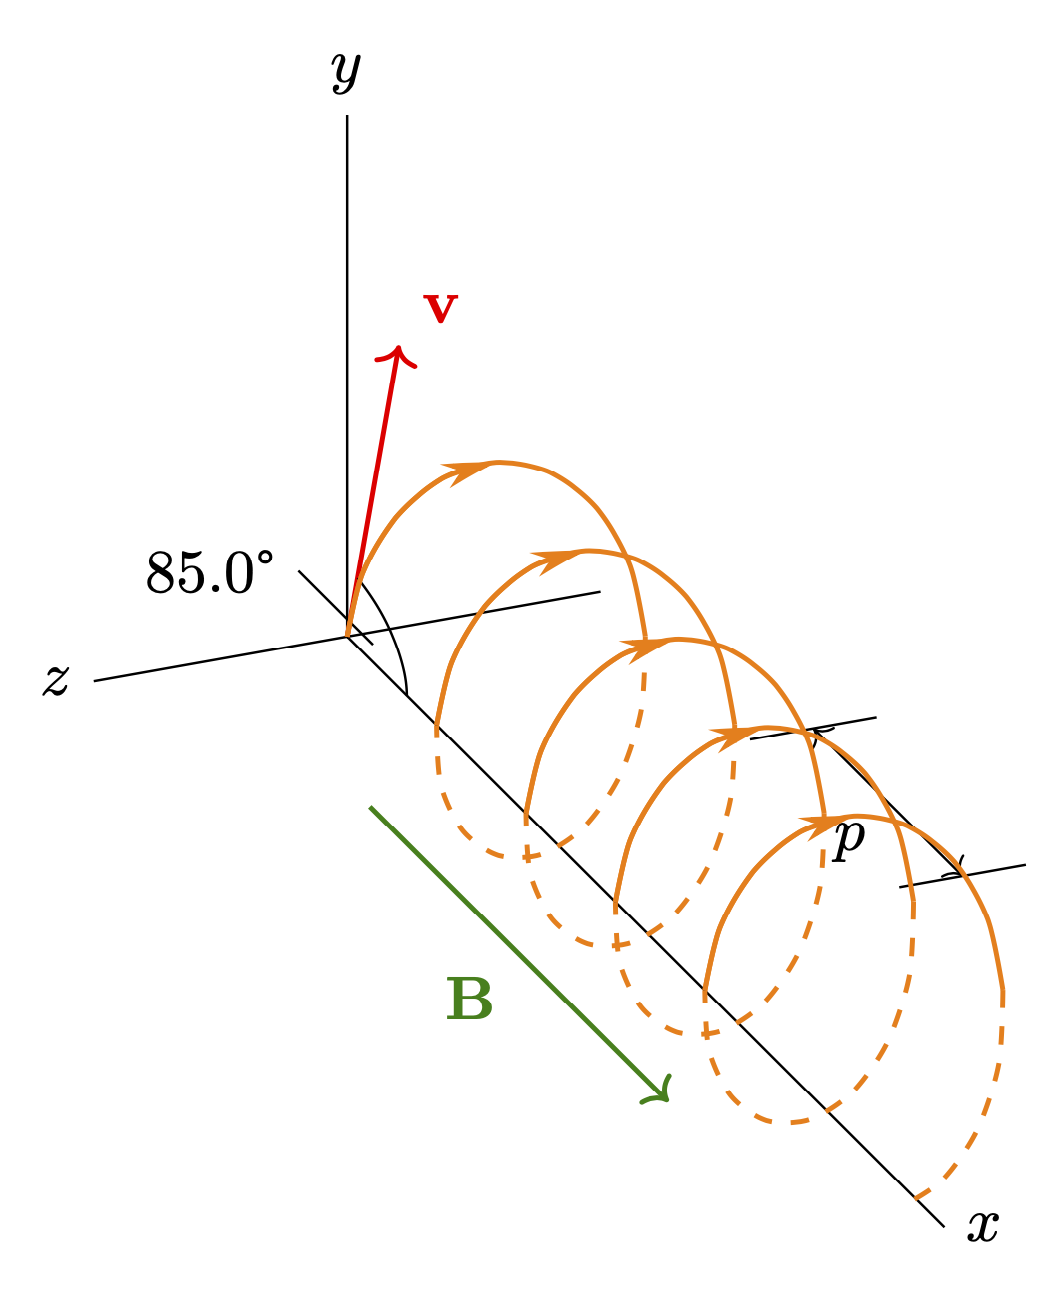
You can just draw a parametric curve. I added such a curve to your code.
```
\documentclass[tikz,margin=3mm]{standalone}
\usetikzlibrary{3d,arrows.meta,bending}
\usepackage{siunitx}
\begin{document}
\begin{tikzpicture}[x=(-45:1.2),z=(45:1.2),declare function={r=1;s=1/600;}]
\draw (0,0,0) -- (4,0,0) node[right] {$x$}
(0,0,0) -- (0,3,0) node[above] {$y$}
(0,0,2) -- (0,0,-2) node[left] {$z$};
\begin{scope}[canvas is xy plane at z=0]
\draw[thick,red,->] (0,0) -- (80:2) node[above right] {$\mathbf{v}$};
\draw (.4,0) arc (0:80:.4);
\coordinate (x) at (30:.2);
\end{scope}
\draw (x) -- ++ (-.5,0) node[left] {\ang{85.0}};
\draw[thick,green!50!black,->] (1,0,-1) -- (3,0,-1)
node[midway,below left] {$\mathbf{B}$};
\draw (1,0,2) -- (1,0,3) (2,0,2) -- (2,0,3);
\draw[<->] (1,0,2.5) -- (2,0,2.5) node[midway,below left] {$p$};
\foreach \X in {0,...,4}
{\ifnum\X=4
\draw[orange,thick,dashed]
plot[variable=\t,domain=180:270,smooth,samples=5]
(s*\X*360+s*\t,{r*sin(\t)},{r-r*cos(\t)});
\else
\draw[orange,thick,dashed]
plot[variable=\t,domain=180:360,smooth,samples=9]
(s*\X*360+s*\t,{r*sin(\t)},{r-r*cos(\t)});
\fi
\draw[orange,thick,-{Stealth[bend,length=3mm,width=1.5mm]}]
plot[variable=\t,domain=0:90,smooth,samples=5]
(s*\X*360+s*\t,{r*sin(\t)},{r-r*cos(\t)});
\draw[orange,thick] plot[variable=\t,domain=0:180,smooth,samples=9]
(s*\X*360+s*\t,{r*sin(\t)},{r-r*cos(\t)});}
\end{tikzpicture}
\end{document}
```
If you install an orthographic projection, you get something like
```
\documentclass[tikz,margin=3mm]{standalone}
\usepackage{tikz-3dplot}
\usetikzlibrary{3d,arrows.meta,bending}
\usepackage{siunitx}
\begin{document}
\tdplotsetmaincoords{60}{70}
\begin{tikzpicture}[tdplot_main_coords,declare function={r=1;s=1/600;}]
\path (0,0,1) coordinate (ey) (1,0,0) coordinate (ex) (0,1,0) coordinate (ez);
\begin{scope}[x={(ex)},y={(ey)},z={(ez)}]
\draw (0,0,0) -- (4,0,0) node[right] {$x$}
(0,0,0) -- (0,3,0) node[above] {$y$}
(0,0,2) -- (0,0,-2) node[left] {$z$};
\begin{scope}[canvas is xy plane at z=0]
\draw[thick,red,->] (0,0) -- (80:2) node[above right] {$\mathbf{v}$};
\draw (.4,0) arc (0:80:.4);
\coordinate (x) at (30:.2);
\end{scope}
\draw (x) -- ++ (-.5,0) node[left] {\ang{85.0}};
\draw[thick,green!50!black,->] (1,0,-1) -- (3,0,-1)
node[midway,below left] {$\mathbf{B}$};
\draw (1,0,2) -- (1,0,3) (2,0,2) -- (2,0,3);
\draw[<->] (1,0,2.5) -- (2,0,2.5) node[midway,below left] {$p$};
\foreach \X in {0,...,4}
{\ifnum\X=4
\draw[orange,thick,dashed]
plot[variable=\t,domain=180:270,smooth,samples=5]
(s*\X*360+s*\t,{r*sin(\t)},{r-r*cos(\t)});
\else
\draw[orange,thick,dashed]
plot[variable=\t,domain=180:360,smooth,samples=9]
(s*\X*360+s*\t,{r*sin(\t)},{r-r*cos(\t)});
\fi
\draw[orange,thick,-{Stealth[bend,length=3mm,width=1.5mm]}]
plot[variable=\t,domain=0:90,smooth,samples=5]
(s*\X*360+s*\t,{r*sin(\t)},{r-r*cos(\t)});
\draw[orange,thick] plot[variable=\t,domain=0:180,smooth,samples=9]
(s*\X*360+s*\t,{r*sin(\t)},{r-r*cos(\t)});}
\end{scope}
\end{tikzpicture}
\end{document}
```
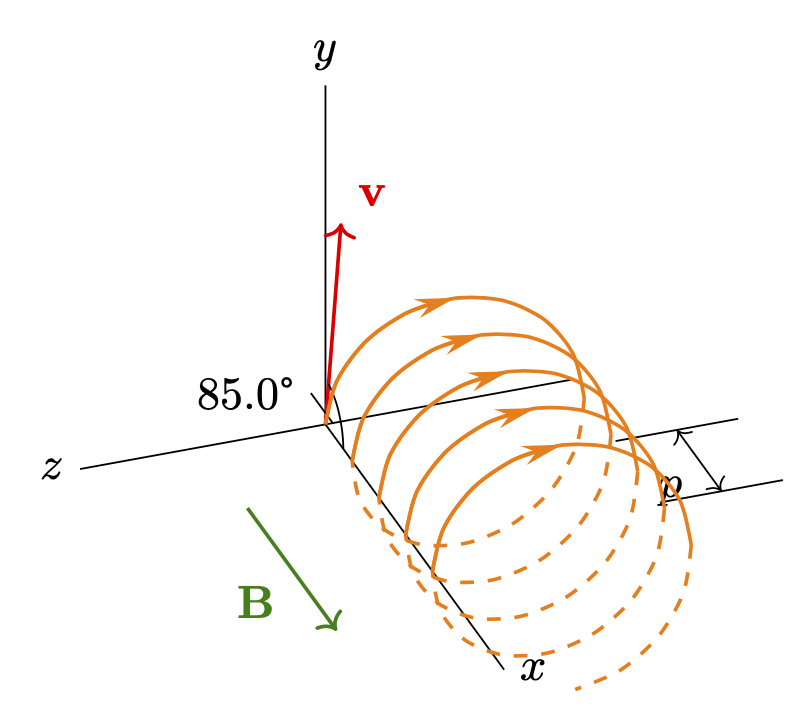
You can adjust the parameters of `\tdplotsetmaincoords{60}{70}` to change the view. Note that your coordinate system has an unconventional orientation in that the orthogonal transformation that installs the view has determinant -1. In other words, in your picture the righthanded rather the lefthanded particles participate in the weak interactions. As illustrated [here](https://xkcd.com/2364/)

this may have unpleasant consequences. :smile_cat: