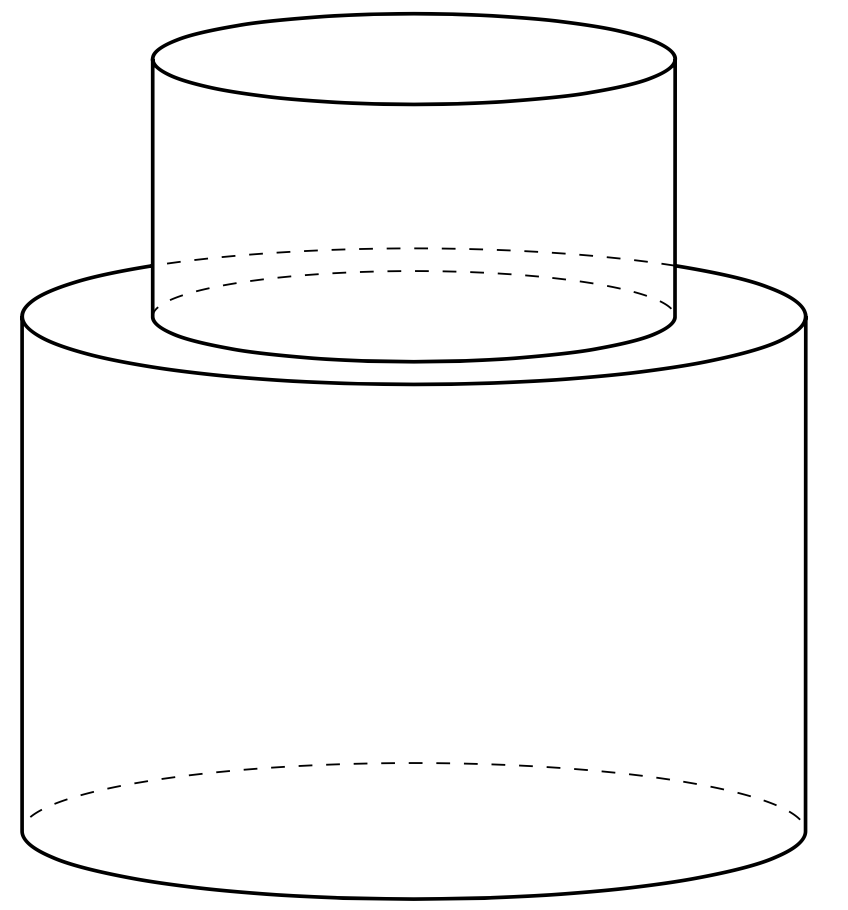
You already determined the critical angle for single cylinders. There is only one more critical angle which determines which fraction of the larger cylinder is covered by the smaller one. In the case at hand, this is just the `arcsin` of the ratio `r/R` plus some stuff that depends on the view angle `phi`. In more complicated settings you could work with clips and reverse clips, but here it is easier to work with the analytic solution.
```
\documentclass[border=1mm,tikz]{standalone}
\usepackage{tikz-3dplot}
\begin{document}
\tdplotsetmaincoords{80}{70}
\begin{tikzpicture}[tdplot_main_coords,
visible/.style={thick},hidden/.style={dashed},
declare function={H=4;h=2;R=3;r=2;phi1=\tdplotmainphi;
phi2=\tdplotmainphi+180;phi3=\tdplotmainphi-180;
phi4=\tdplotmainphi+90+asin(r/R);
phi5=\tdplotmainphi+90-asin(r/R);
}]
\path (0,0,H) coordinate(M) (0,0,H+h) coordinate(m)
({R*cos(phi1)},{R*sin(phi1)},0 ) coordinate (BL)
({R*cos(phi2)},{R*sin(phi2)},0 ) coordinate (BR)
({R*cos(phi1)},{R*sin(phi1)},H ) coordinate (TL)
({R*cos(phi2)},{R*sin(phi2)},H ) coordinate (TR)
({r*cos(phi1)},{r*sin(phi1)},H ) coordinate (bl)
({r*cos(phi2)},{r*sin(phi2)},H ) coordinate (br)
({r*cos(phi1)},{r*sin(phi1)},H+h) coordinate (tl)
({r*cos(phi2)},{r*sin(phi2)},H+h) coordinate (tr);
\begin{scope}[canvas is xy plane at z=0]
\draw[hidden] (br) arc[start angle=phi3,end angle=phi2,radius=r]
(BR) arc[start angle=phi3,end angle=phi2,radius=R]
($(M)+(phi5:R)$) arc[start angle=phi5,end angle=phi4,radius=R];
\draw[visible] (tr) -- (br)
arc[start angle=phi3,end angle=phi1,radius=r] -- (tl)
(m) circle[radius=r]
(TR) -- (BR) arc[start angle=phi3,end angle=phi1,radius=R] -- (TL)
($(M)+(phi5:R)$) arc[start angle=phi5,end angle=phi4-360,radius=R];
\end{scope}
\end{tikzpicture}
\end{document}
```

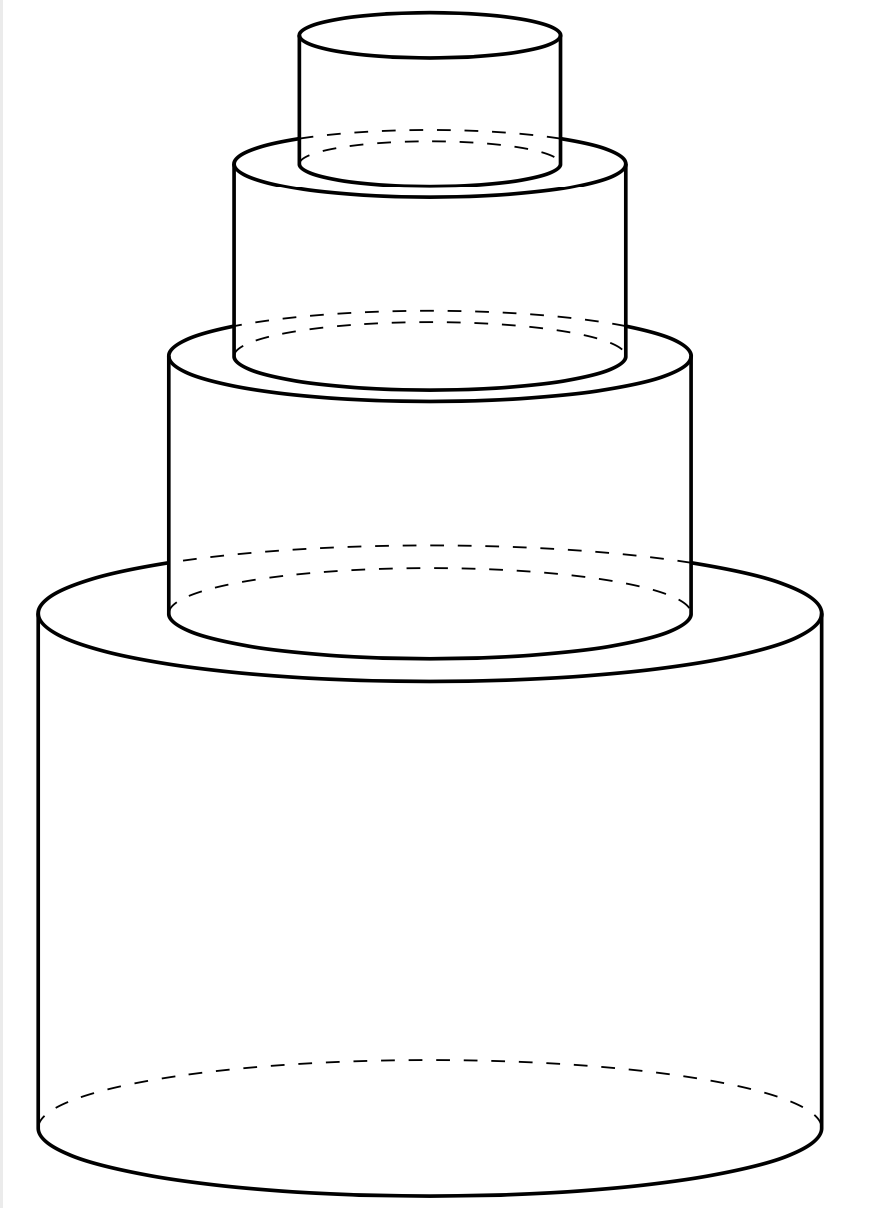
You can iterate this in a loop. The heights and radii are stored in the lists `lH` and `lR`, respectively.
```
\documentclass[border=1mm,tikz]{standalone}
\usepackage{tikz-3dplot}
\begin{document}
\tdplotsetmaincoords{80}{70}
\begin{tikzpicture}[tdplot_main_coords,
visible/.style={thick},hidden/.style={dashed},
declare function={lH={4,2,1.5,1};% list of heights
lR={3,2,1.5,1};% list of radii
phi0=\tdplotmainphi+90;
phihid(\r,\R)=asin(\r/\R);
}]
\pgfmathtruncatemacro{\mydim}{dim(lH)-1}
\pgfmathsetmacro{\myh}{0}
\path (0,0,\myh) coordinate (M0);
\foreach \X [remember=\myh as \myh,count=\Y] in {0,...,\mydim}
{\pgfmathsetmacro{\myh}{\myh+{lH}[\X]}
\pgfmathsetmacro{\myr}{{lR}[\X]}
\path (0,0,\myh) coordinate (M\Y);
\begin{scope}[canvas is xy plane at z=0]
\draw[hidden] ($(M\X)+(phi0+90:\myr)$)
arc[start angle=phi0+90,end angle=phi0-90,radius=\myr];
\draw[visible] ($(M\Y)+(phi0-270:\myr)$)
-- ($(M\X)+(phi0-270:\myr)$)
arc[start angle=phi0-270,end angle=phi0-90,radius=\myr]
-- ($(M\Y)+(phi0-90:\myr)$);
\ifnum\X=\mydim
\draw[visible] (M\Y) circle[radius=\myr];
\else
\pgfmathsetmacro{\myphicrit}{phihid({lR}[\Y],\myr)}
\draw[hidden] ($(M\Y)+(phi0-\myphicrit:\myr)$)
arc[start angle=phi0-\myphicrit,end angle=phi0+\myphicrit,radius=\myr];
\draw[visible]
($(M\Y)+(phi0-\myphicrit:\myr)$)
arc[start angle=phi0-\myphicrit,end angle=phi0+\myphicrit-360,radius=\myr];
\fi
\end{scope}
}
\end{tikzpicture}
\end{document}
```
