topnush

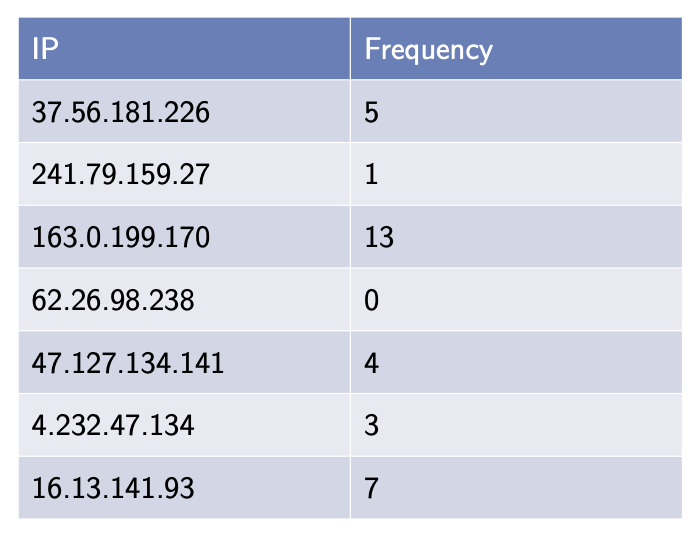
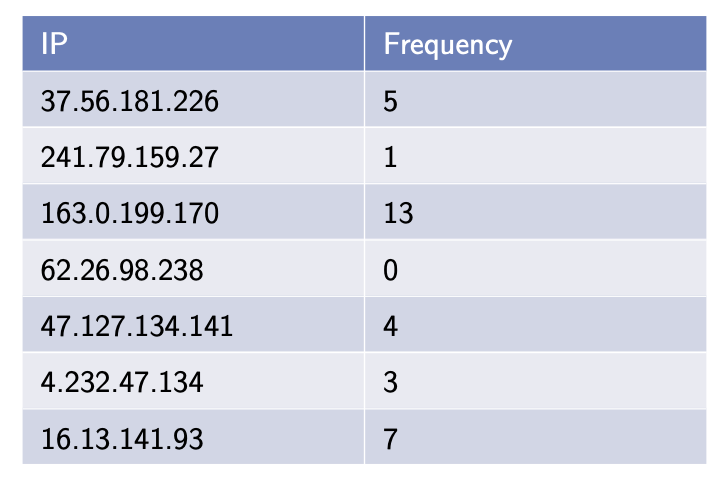
I would like to make something that looks like
to put in a beamer frame in texlive 2019. I tried just copying nicematrix.sty but even then some of the examples in the manual fail so I think I need a non-nicematrix solution.
```
\documentclass{beamer}
\begin{document}
\begin{frame}{Frame Title}
\begin{tabular}{l|l}
IP & Frequency \\
37.56.181.226 & 5\\
241.79.159.27 & 1\\
163.0.199.170 & 13\\
62.26.98.238 & 0\\
47.127.134.141 & 4\\
4.232.47.134 & 3 \\
16.13.141.93 & 7\\
\end{tabular}
\end{frame}
\end{document}`
Top Answer
user 3.14159

Since you indicated that you are using TeXLive2019, I would probably use a matrix from Ti*k*Z. You can use the counts `\pgfmatrixcurrentrow` and `\pgfmatrixcurrentcolumn` to achieve any coloring pattern you want.
```
\documentclass{article}
\usepackage{tikz}
\usetikzlibrary{matrix}
\definecolor{blue0}{RGB}{97,128,186}
\definecolor{blue2}{RGB}{209,215,230}
\definecolor{blue1}{RGB}{233,235,242,}
\begin{document}
\begin{tikzpicture}
\path
[cond/.code={%
\ifnum\pgfmatrixcurrentrow=1\relax
\tikzset{fill=blue0,text=white}%
\else
\ifodd\pgfmatrixcurrentrow
\tikzset{fill=blue1}%
\else
\tikzset{fill=blue2}%
\fi
\fi}]
node[matrix of nodes,nodes in empty cells,
ampersand replacement=\&,% <- may be a good choice in beamer documents
nodes={text height=1em,text depth=0.8ex,text width=3.5cm,
inner xsep=1ex,
align=left,font=\sffamily,cond},
column sep=0.4pt,row sep=0.4pt] (mat1) {%
IP \& Frequency \\
37.56.181.226 \& 5\\
241.79.159.27 \& 1\\
163.0.199.170 \& 13\\
62.26.98.238 \& 0\\
47.127.134.141 \& 4\\
4.232.47.134 \& 3 \\
16.13.141.93 \& 7\\
};
\end{tikzpicture}
\end{document}
```
Once you have a more recent version of TeXLive, you may want to look at the `nicematrix` package.
```
\documentclass{article}
\usepackage{nicematrix}
\definecolor{blue0}{RGB}{97,128,186}
\definecolor{blue2}{RGB}{209,215,230}
\definecolor{blue1}{RGB}{233,235,242,}
\begin{document}
\begingroup\sffamily\renewcommand{\arraystretch}{1.5}\arrayrulecolor{white}%
\begin{NiceTabular}[c]{Wl{3.5cm}|Wl{3.5cm}}%
[code-before = \rowcolor{blue0}{1} \rowcolors{2}{blue1}{blue2}]
\textcolor{white}{IP} & \textcolor{white}{Frequency}\\
\hline
37.56.181.226 & 5\\
\hline
241.79.159.27 & 1\\
\hline
163.0.199.170 & 13\\
\hline
62.26.98.238 & 0\\
\hline
47.127.134.141 & 4\\
\hline
4.232.47.134 & 3 \\
\hline
16.13.141.93 & 7\\
\end{NiceTabular}\endgroup
\end{document}
```
Answer #2
Skillmon

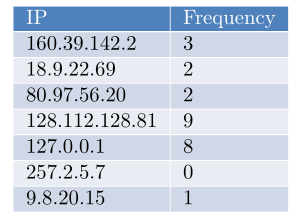
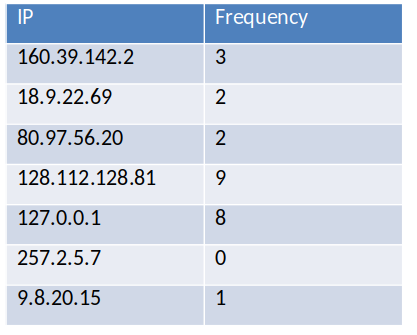
A solution using `xcolor` and `colortbl` (loaded by the `table` option of `xcolor`, which also defines the `\rowcolors` macro).
```
\documentclass[]{article}
\usepackage[table]{xcolor}
\definecolor{tblhead}{HTML}{4F81BD}
\definecolor{tblrowA}{HTML}{D0D8E7}
\definecolor{tblrowB}{HTML}{E9ECF3}
\begin{document}
\begingroup
\arrayrulecolor{white}
\rowcolors{1}{tblrowB}{tblrowA}
\begin{tabular}{l|l}
\rowcolor{tblhead}\color{white}IP & \color{white}Frequency \\
\hline
160.39.142.2 & 3 \\
\hline
18.9.22.69 & 2 \\
\hline
80.97.56.20 & 2 \\
\hline
128.112.128.81 & 9 \\
\hline
127.0.0.1 & 8 \\
\hline
257.2.5.7 & 0 \\
\hline
9.8.20.15 & 1 \\
\end{tabular}
\endgroup
\end{document}
```