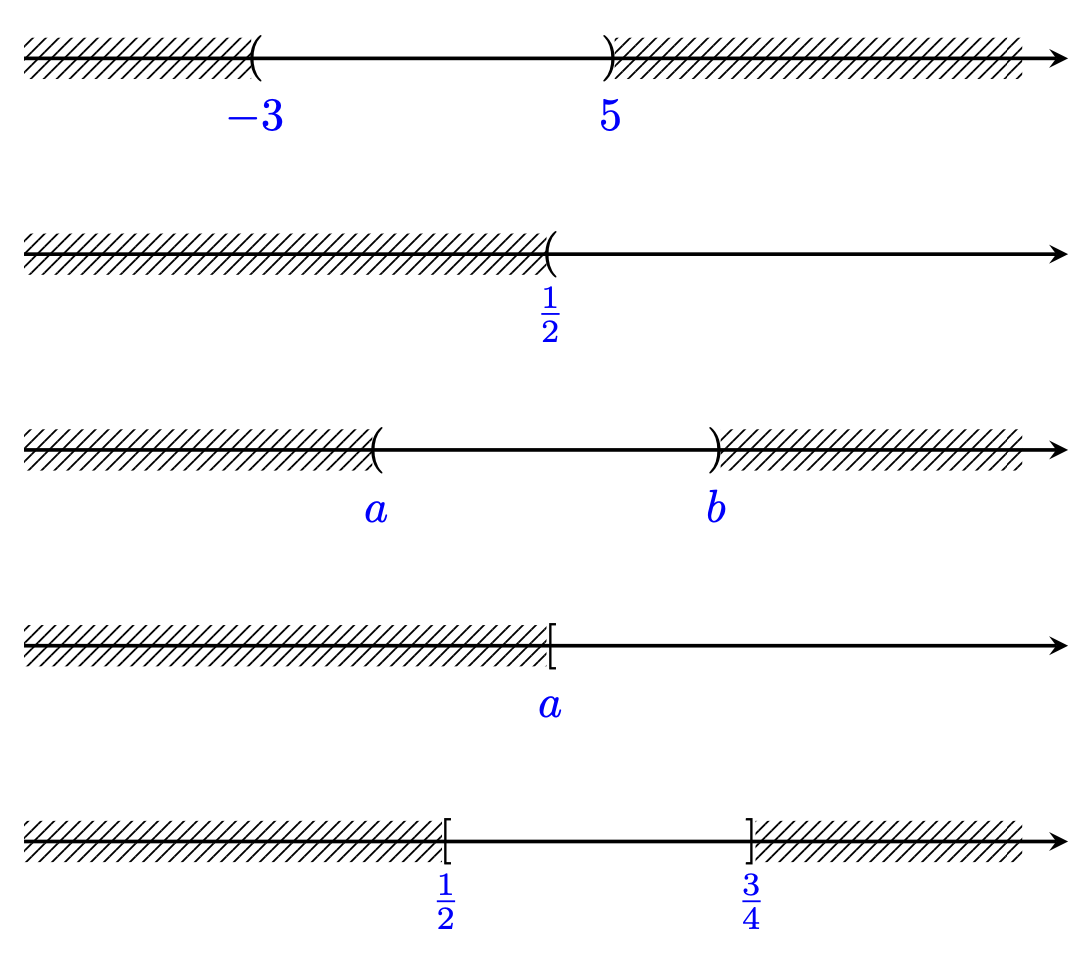
Here is a possible way to do this. A pic is defined that takes various arguments. The axis is scaled to fit a target width, which is given by the `width` key, but you can turn scaling off with `scaled`. There are various other keys for the domains, the delimiters and the annotations, which are explained a bit in the code.
```
\documentclass[tikz,border=3mm]{standalone}
\usetikzlibrary{patterns.meta}
\tikzset{pics/interval/.style={code={%
\def\pv##1{\pgfkeysvalueof{/tikz/interval/##1}}%
\tikzset{interval/.cd,#1}%
\iftikzintervalscaled
\pgfmathsetmacro{\myintervalscale}{\pv{width}/(\pv{xmax}-\pv{xmin})/1cm}%
\else
\pgfmathsetmacro{\myintervalscale}{1}%
\fi
\pgfmathsetmacro{\xmid}{\pv{xmax}/2+\pv{xmin}/2}%
\begin{scope}[xscale=\myintervalscale,shift={(-\xmid,0)}]
\draw[interval/axis] (\pv{xmin},0) -- (\pv{xmax},0);
\pgfmathtruncatemacro{\itest}{(\pv{xmin}<\pv{imin})}%
\ifnum\itest=1
\path[interval/excluded]
(\pv{xmin},-\pv{h}/2) rectangle (\pv{imin},\pv{h}/2);
\path ([xshift=0.2ex/\myintervalscale]\pv{imin},0) node {$\pv{left}$}
node[interval/both labels,interval/left label]{$\pv{l}$};
\fi
\pgfmathtruncatemacro{\itest}{(\pv{xmax}>\pv{imax})}%
\ifnum\itest=1
\path[interval/excluded]
(\pv{imax},-\pv{h}/2) rectangle ([xshift=-1em/\myintervalscale]\pv{xmax},\pv{h}/2);
\path ([xshift=-0.2ex/\myintervalscale]\pv{imax},0) node {$\pv{right}$}
node[interval/both labels,interval/right label]{$\pv{r}$};
\fi
\end{scope}
}},
interval/.cd,axis domain/.code args={#1:#2}{%
\tikzset{interval/.cd,xmin=#1,xmax=#2}%
},interval domain/.code args={#1:#2}{%
\tikzset{interval/.cd,imin=#1,imax=#2}%
},xmin/.initial=-5,xmax/.initial=5,
imin/.initial=0,imax/.initial=1,
left/.initial={(},right/.initial={)},
scaled/.is if=tikzintervalscaled,scaled/.default=true,
width/.initial=8cm,h/.initial=9pt,
axis/.style={thick,-stealth},
excluded/.style={pattern={Lines[angle=45,distance={2pt}]}},
both labels/.style={below,text=blue,text height=1.2em},
left label/.style={},right label/.style={},
l/.initial={\pv{imin}},r/.initial={\pv{imax}}
}
\newif\iftikzintervalscaled
\tikzintervalscaledtrue
\begin{document}
\begin{tikzpicture}
% the axis domain denotes the domain of the arrow
% the interval domain is just the interval
% by default the upper and lower interval bounds are used for the nodes
\path (0,0) pic{interval={axis domain=-8:15,interval domain=-3:5}}
% but you can overwrite them with the l and r keys
++ (0,-1.5) pic{interval={axis domain=0:1,interval domain=1/2:1,l={\frac{1}{2}}}}
++ (0,-1.5) pic{interval={axis domain=0:1,interval domain=1/3:2/3,l={a},r={b}}}
% initially the delimiters are ( and ) but you can change them using
% the left and right keys
++ (0,-1.5) pic{interval={axis domain=0:1,interval domain=1/2:1,l={a},left={[}}}
++ (0,-1.5) pic{interval={axis domain=1/6:1,interval domain=1/2:3/4,
l={\frac{1}{2}},r={\frac{3}{4}},
left={[},right={]}}};
\end{tikzpicture}
\end{document}
```

There are various ways in which one could extend this, e.g. by parsing some interval definition like `[1/2,3/4(` and set the domain and delimiters accordingly.