The depicted projection is not orthographic. I copy the proof from [here](https://tex.stackexchange.com/a/448048).
```
\documentclass[fleqn]{article}
\usepackage{amsmath,marvosym}
\begin{document}
You wish to have a coordinate system that
\begin{enumerate}
\item preserves shapes and\label{preserve}
\item has $\vec e_y$ point east, $\vec e_z$ point north and $\vec e_x$ point
south west.\label{directions}
\end{enumerate}
The first requirement means that the coordinate axes are orthogonal,
\begin{equation}\label{eq:orthogonality}
\vec e_x\cdot \vec e_y~=~\vec e_x\cdot \vec e_z~=~\vec e_y\cdot \vec e_z
~=~0\;.
\end{equation}
So we wish to find a two--dimensional projection of these vectors that fulfill
the requirement \ref{directions}. Decompose the vectors in two--dimensional
projections on the paper plane $\vec e_i^{(\|)}$ and the orthogonal complements
$\vec e_i^{(\perp)}$. Clearly, the $\vec e_i^{(\perp)}$ are just
one--dimensional objects, which we will just call $e_i^{(\perp)}$. Requirement \ref{directions} implies that
\begin{equation}
\vec e_x^{(\|)} \cdot \vec e_y^{(\|)}=
\vec e_x^{(\|)} \cdot \vec e_z^{(\|)}=:\xi\ne0\;.
\end{equation}
Due to the orthogonality relations \eqref{eq:orthogonality}, this means that
\begin{equation}
e_x^{(\perp)} \cdot e_y^{(\perp)}=
e_x^{(\perp)} \cdot e_z^{(\perp)}=-\xi~\ne~0\;.
\end{equation}
None of the $e_i^{(\perp)}$ may vanish as otherwise there won't be an $x$--axis,
and
\begin{equation}
e_y^{(\perp)}=e_z^{(\perp)}=-\frac{\xi}{e_x^{(\perp)}}\;.
\end{equation}
However, requirement \ref{directions}
implies that $\vec e_y^{(\|)} \cdot \vec e_z^{(\|)}=0$, so
\begin{equation}
\vec e_y\cdot \vec e_z=\vec e_y^{(\|)} \cdot \vec e_z^{(\|)}
+e_y^{(\perp)} \cdot e_z^{(\perp)}=0+\left(\frac{\xi}{e_x^{(\perp)}}\right)^2
~\ne~0\;.\qquad \text{\Huge\Lightning}
\end{equation}
\end{document}
```
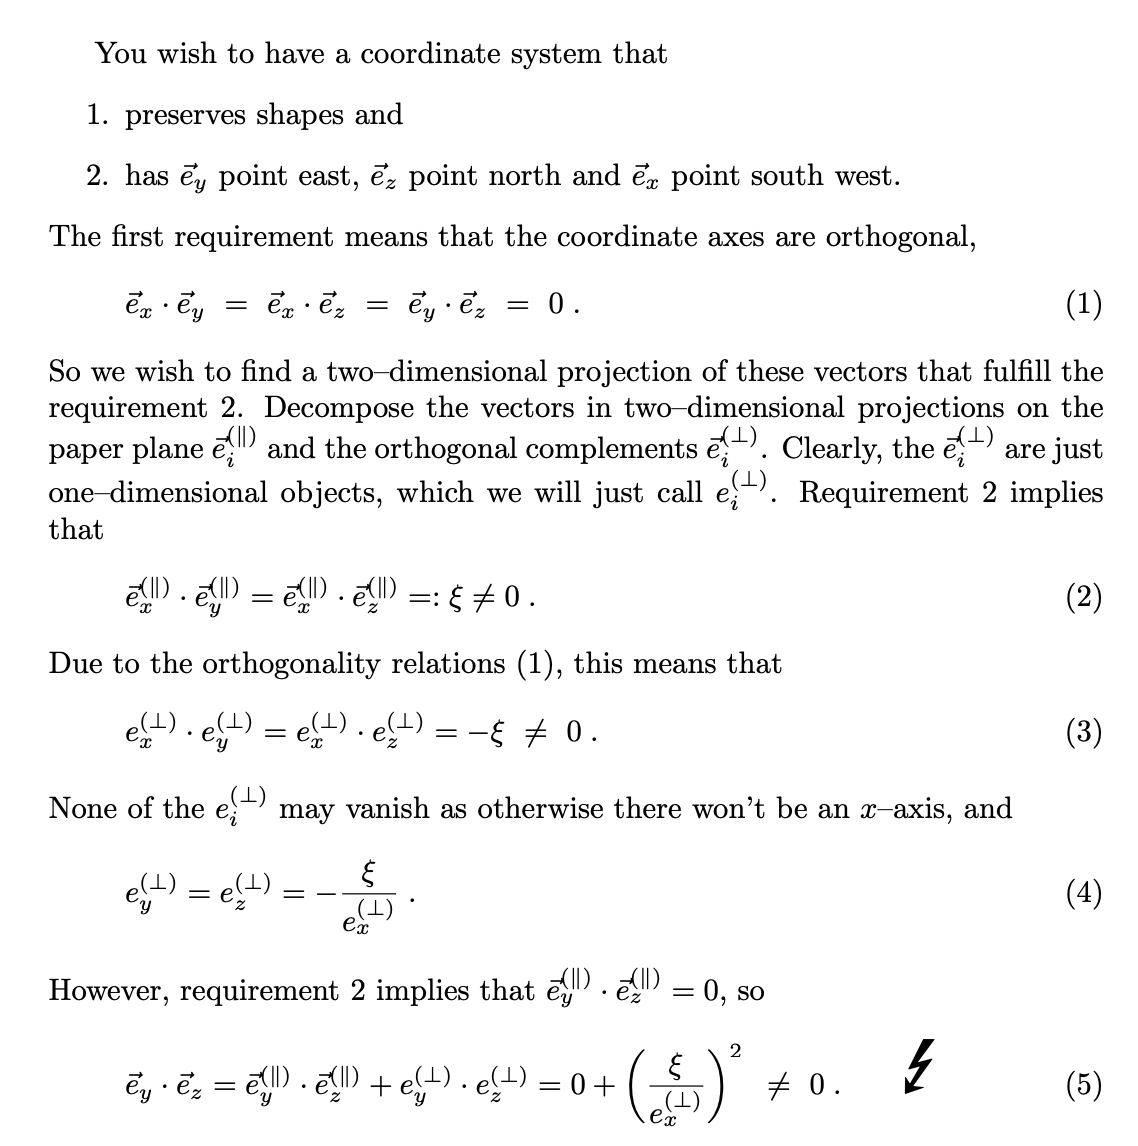
So we need to install a non-orthographic view, so we won't need `tikz-3dplot`. Here is an example. We just define `(ex)` to point to the right, `(ez)` to point up, and take some `(ey)` vector, which can be changed to get a different/better/nicer result.
```
\documentclass[12pt,tikz,border = 3mm]{standalone}
\usetikzlibrary{3d}
\begin{document}
\begin{tikzpicture}[scale=1,declare function={a=5;}]
\path (1,0) coordinate (ex) (40:0.7) coordinate (ey) (0,1) coordinate (ez);
\begin{scope}[x={(ex)},y={(ey)},z={(ez)},transform shape,
pics/.cd,squares/.style={code={
\draw (-a,-a) rectangle (a,a)
(-a/3,-a/3) rectangle (a/3,a/3);
}}]
\path[canvas is xy plane at z=a] pic{squares};
\path[canvas is xz plane at y=-a] pic{squares};
\path[canvas is yz plane at x=a] pic{squares};
\end{scope}
\end{tikzpicture}
\end{document}
```
If you have repetive tasks, you can use `pic`s in which you only change the basis vectors.
```
\documentclass[12pt,tikz,border = 3mm]{standalone}
\usetikzlibrary{calc}
\begin{document}
\begin{tikzpicture}[scale=1,declare function={a=5;b=0;}]
\path (1,0) coordinate (ex) (40:0.7) coordinate (ey) (0,1) coordinate (ez);
\begin{scope}[transform shape,pics/.cd,side/.style={code={\ifcase#1
\edef\mycs{x={(ex)},y={(ey)},z={(ez)}}
\or
\edef\mycs{x={(ey)},y={(ez)},z={(ex)}}
\or
\edef\mycs{x={(ez)},y={(ex)},z={($-1*(ey)$)}}
\fi
\begin{scope}[style/.expanded=\mycs]
\draw
(-a,-a,a) -- (a,-a,a) -- (a,a,a) -- (-a,a,a) -- cycle
(-a/3,-a/3,a) -- (a/3,-a/3,a) -- (a/3,a/3,a) -- (-a/3,a/3,a) -- cycle;
\clip (-a/3,-a/3,a) -- (a/3,-a/3,a) -- (a/3,a/3,a) -- (-a/3,a/3,a) -- cycle;
\draw[fill=gray!10] (-a/3,-a/3,a) -- (a/3,-a/3,a)
-- (a/3,-a/3,b) -- (-a/3,-a/3,b) -- cycle;
\draw[fill=gray!20] (-a/3,-a/3,a) -- (-a/3,a/3,a)
-- (-a/3,a/3,b) -- (-a/3,-a/3,b) -- cycle;
\draw[fill=gray!30] (-a/3,a/3,a) -- (a/3,a/3,a)
-- (a/3,a/3,b) -- (-a/3,a/3,b) -- cycle;
\draw[fill=gray!40] (a/3,a/3,a) -- (a/3,-a/3,a)
-- (a/3,-a/3,b) -- (a/3,a/3,b) -- cycle;
\end{scope}
}}]
\path pic{side=0};
\path pic{side=1};
\path pic{side=2};
\end{scope}
\end{tikzpicture}
\end{document}
```
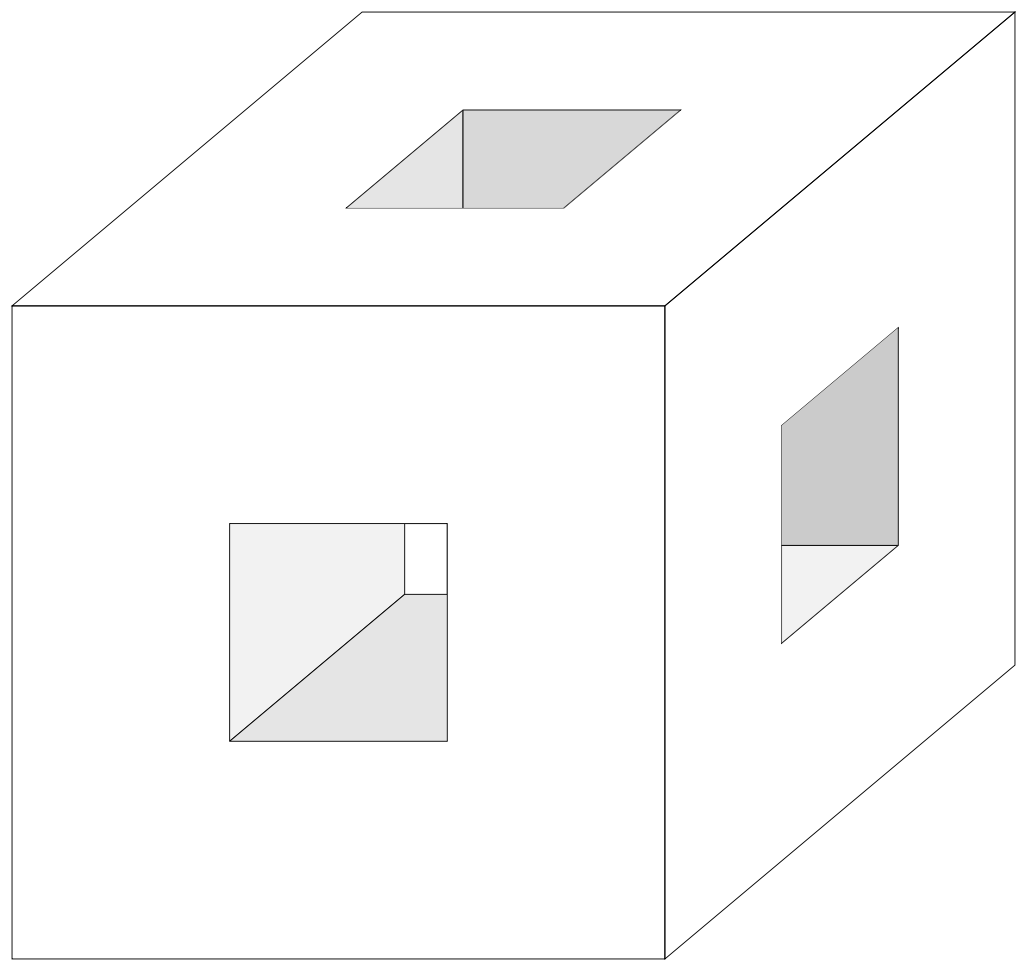
Of course, if you use nonorthographic projections, you cannot change the view angles simply because there are no well defined view angles.
However, it is of course possible to do the same things with an orthographic view. Then all one has do is to flip some signs depending on the view angle, or the screen depth of the basis vectors.
```
\documentclass[12pt,tikz,border=3mm]{standalone}
\usepackage{tikz-3dplot}
\usetikzlibrary{3dtools}
\begin{document}
\foreach \Angle in {5,15,...,355}
{\tdplotsetmaincoords{70}{\Angle}
\begin{tikzpicture}[tdplot_main_coords,scale=1,declare function={a=5;b=0;}]
\path (1,0,0) coordinate (ex) (0,1,0) coordinate (ey) (0,0,1) coordinate (ez);
\path[tdplot_screen_coords,use as bounding box] (-1.5*a,-1.5*a) rectangle (1.5*a,1.5*a);
\begin{scope}[transform shape,pics/.cd,side/.style={code={\ifcase##1
\pgfmathsetmacro{\iflip}{sign(screendepth(0,0,1))}
\edef\mycs{x={(ex)},y={(ey)},z={($\iflip*(ez)$)}}
\or
\pgfmathsetmacro{\iflip}{sign(screendepth(1,0,0))}
\edef\mycs{x={(ey)},y={(ez)},z={($\iflip*(ex)$)}}
\or
\pgfmathsetmacro{\iflip}{sign(screendepth(0,1,0))}
\edef\mycs{x={(ez)},y={(ex)},z={($\iflip*(ey)$)}}
\fi
\begin{scope}[style/.expanded=\mycs]
\draw
(-a,-a,a) -- (a,-a,a) -- (a,a,a) -- (-a,a,a) -- cycle
(-a/3,-a/3,a) -- (a/3,-a/3,a) -- (a/3,a/3,a) -- (-a/3,a/3,a) -- cycle;
\clip (-a/3,-a/3,a) -- (a/3,-a/3,a) -- (a/3,a/3,a) -- (-a/3,a/3,a) -- cycle;
\draw[fill=gray!10] (-a/3,-a/3,a) -- (a/3,-a/3,a)
-- (a/3,-a/3,b) -- (-a/3,-a/3,b) -- cycle;
\draw[fill=gray!20] (-a/3,-a/3,a) -- (-a/3,a/3,a)
-- (-a/3,a/3,b) -- (-a/3,-a/3,b) -- cycle;
\draw[fill=gray!30] (-a/3,a/3,a) -- (a/3,a/3,a)
-- (a/3,a/3,b) -- (-a/3,a/3,b) -- cycle;
\draw[fill=gray!40] (a/3,a/3,a) -- (a/3,-a/3,a)
-- (a/3,-a/3,b) -- (a/3,a/3,b) -- cycle;
\end{scope}
}}]
\path pic{side=0};
\path pic{side=1};
\path pic{side=2};
\end{scope}
\end{tikzpicture}}
\end{document}
```
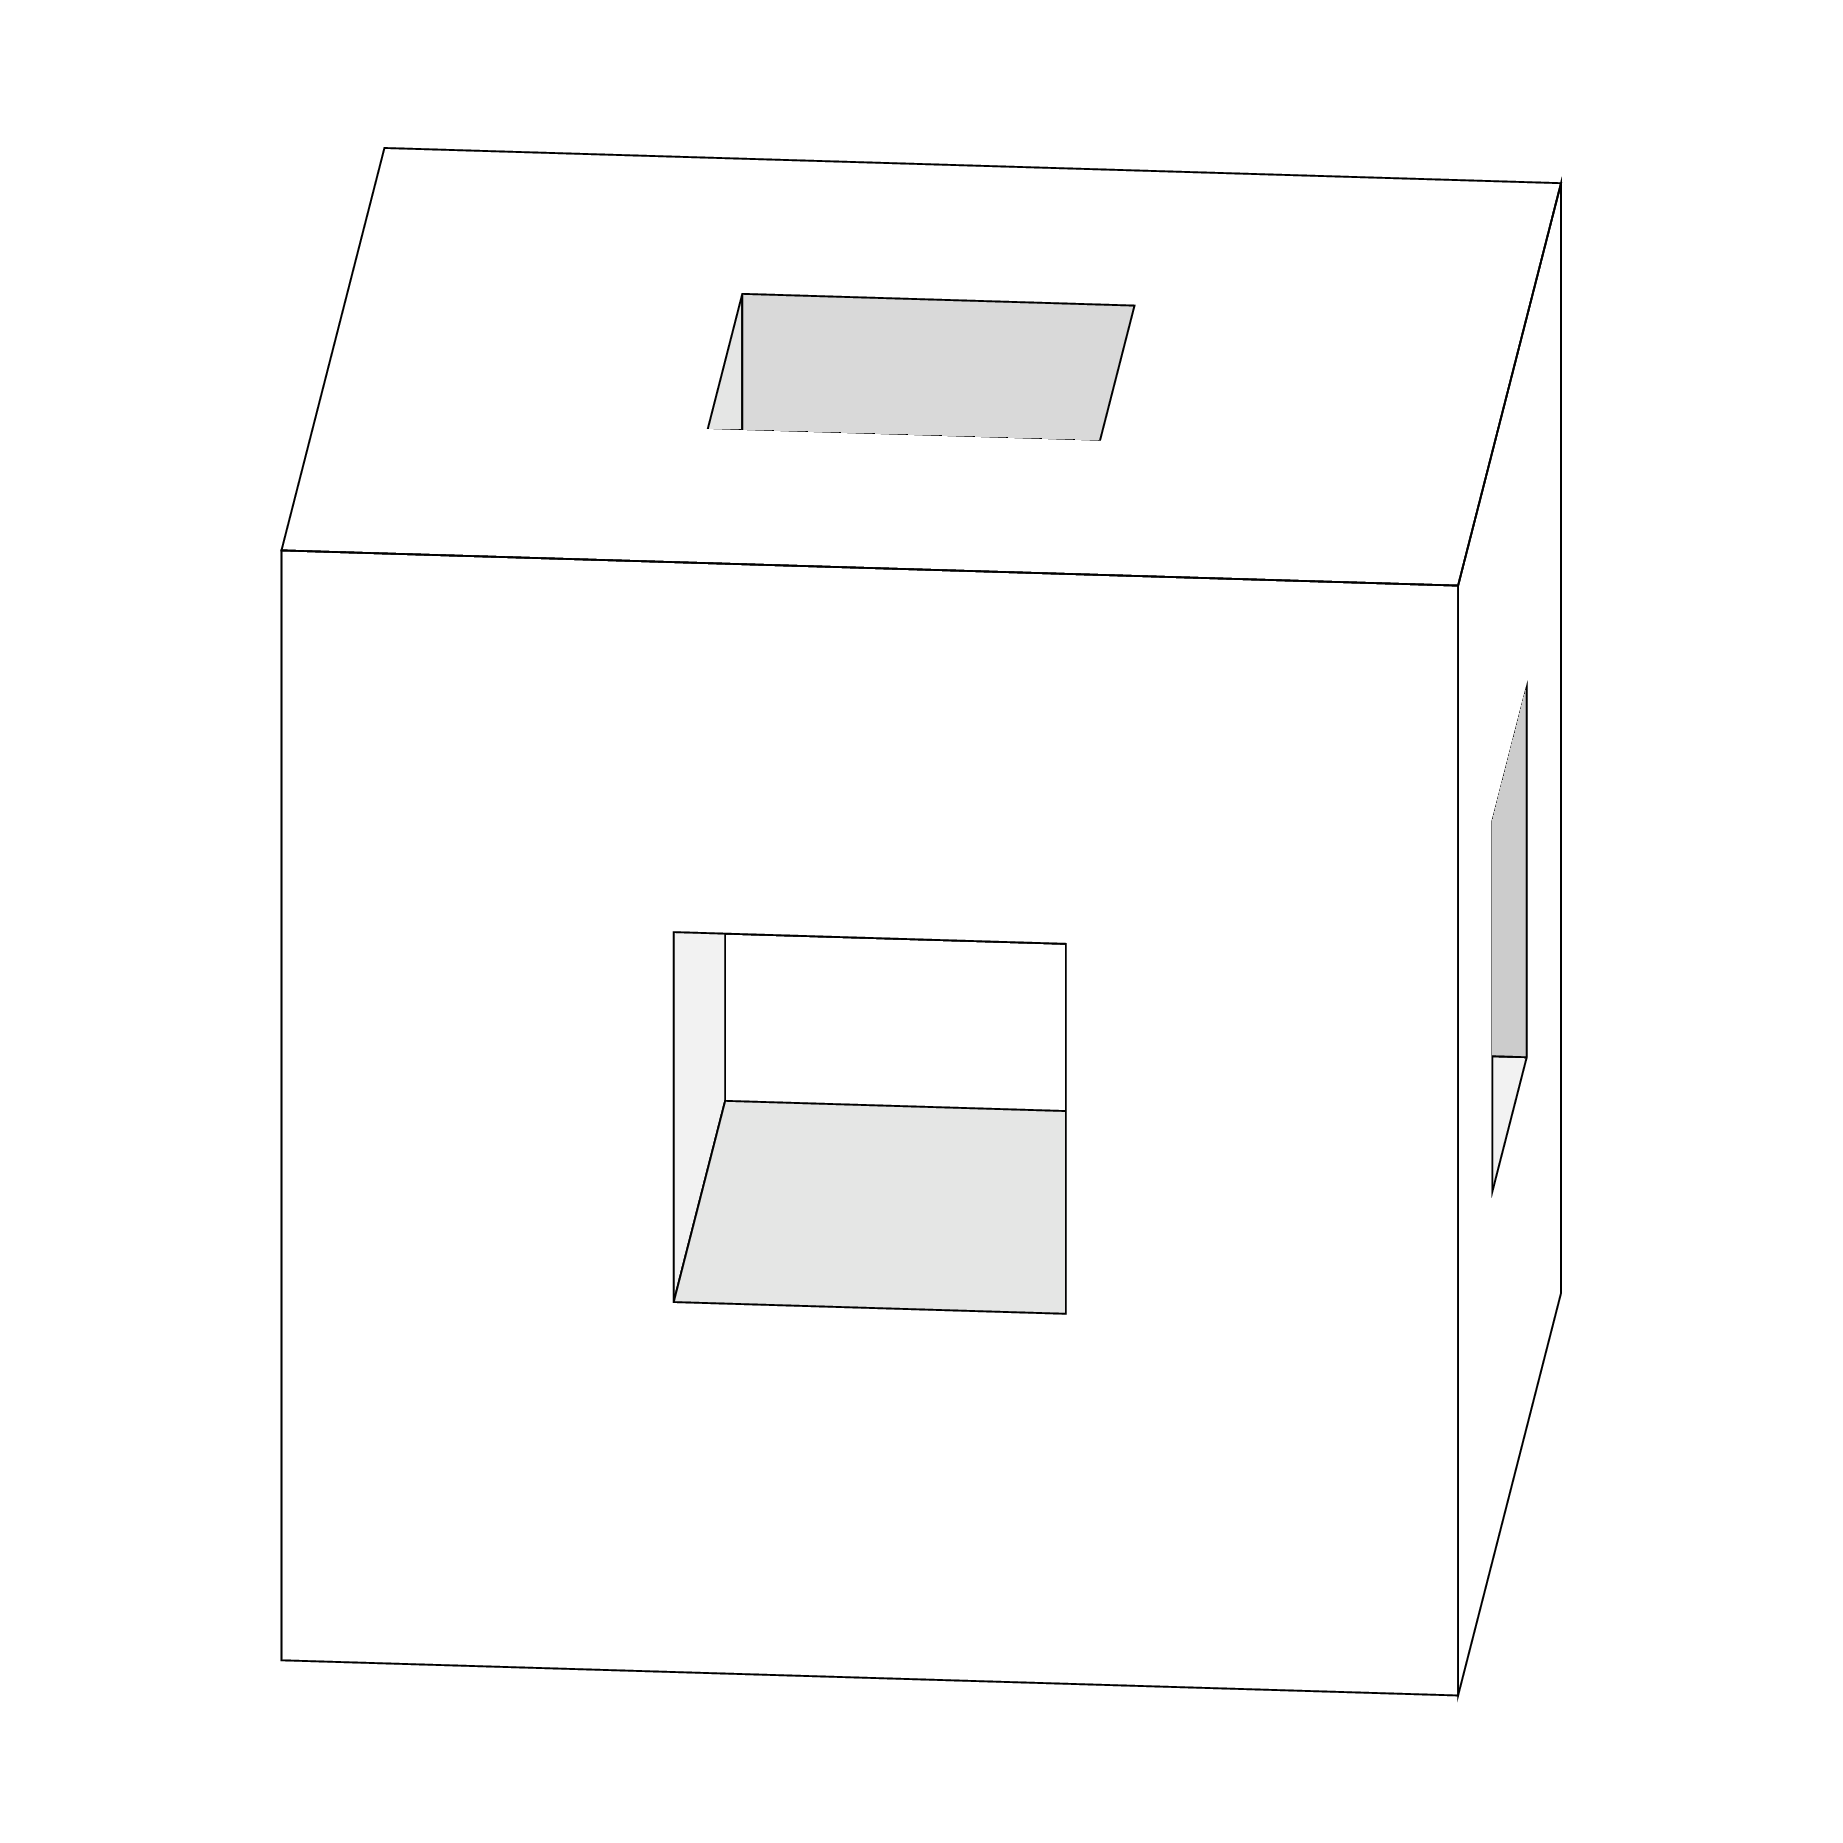
Note that this draws only three faces, so if you want to have a real "look inside" feel this will require more efforts.