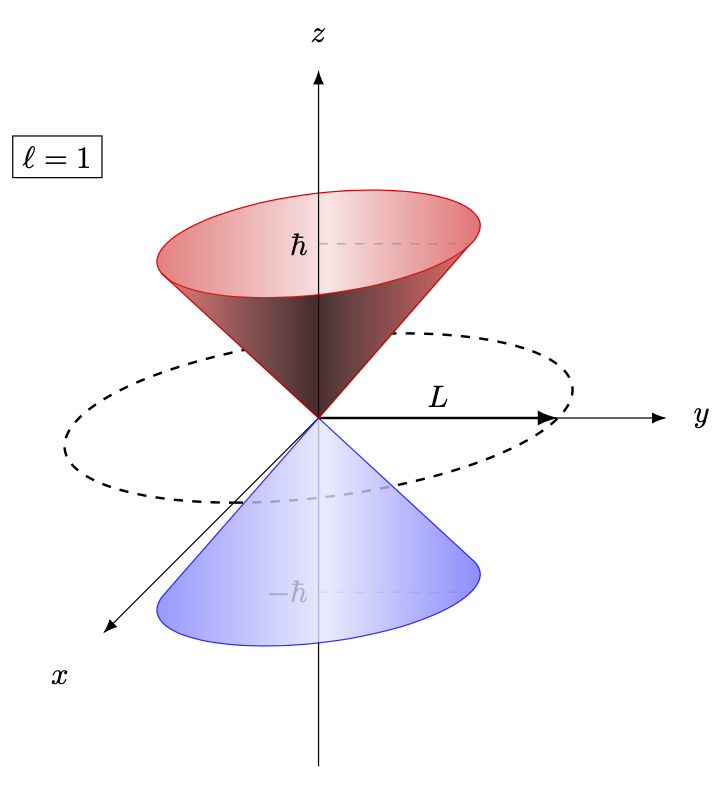
You could use empirical angles.
```
\documentclass[tikz,border=3mm]{standalone}
\usetikzlibrary{arrows.meta,3d}
\begin{document}
\begin{tikzpicture}[declare function={phix=-135;lx=0.5;
tcrit1=87;
tcrit2=303;}]
\path (phix:lx) coordinate (ex) (1,0) coordinate (ey) (0,1) coordinate (ez)
(0,0) coordinate (O);
\begin{scope}[x={(ex)},y={(ey)},z={(ez)}]
\begin{scope}[canvas is xy plane at z=0]
\draw[dashed,thick] circle[radius=2.75cm];
\end{scope}
\begin{scope}[canvas is xy plane at z=2,red]
\draw[left color=red!50,right color=red!60,middle color=red!10]
(tcrit1:1.75) arc[start angle=tcrit1,end angle=tcrit2,radius=1.75]
-- (O) -- cycle;
\end{scope}
\draw[dashed,very thin,draw=gray] (0,0,2) node[left] {$\hbar$} edge ++ (0,1.75,0)
(0,0,-2) node[left] {$-\hbar$} edge ++ (0,1.75,0);
\draw[-Latex] (O) -- (7,0,0) node[pos=1.2] {$x$};
\draw[-Latex] (O) -- (0,4,0) node[pos=1.1] {$y$};
\draw[-Latex] (0,0,-4) -- (0,0,4) node[pos=1.05] {$z$};
\draw[-Latex,thick] (O) -- (0,2.75,0) node[midway,above] {$L$};
\begin{scope}[canvas is xy plane at z=-2,blue,opacity=0.8]
\draw[left color=blue!50,right color=blue!60,middle color=blue!10]
(tcrit2-180:1.75) arc[start angle=tcrit2-180,end angle=-tcrit1,radius=1.75]
-- (O) -- cycle;
\end{scope}
\begin{scope}[canvas is xy plane at z=2,red,opacity=0.8]
\draw[left color=red!50,right color=red!60,middle color=red!10!black]
(tcrit1:1.75) arc[start angle=tcrit1,end angle=tcrit2-360,radius=1.75]
-- (O) -- cycle;
\end{scope}
\end{scope}
\path (-3,3) node[draw]{$\ell=1$};
\end{tikzpicture}
\end{document}
```
