A code that treats all possible view angles is a lot of work. Here is a code the treats one situation that seems to correspond to your screen shot, and an analytic discussion that may help to cover all cases, if needed (a slightly more general code can be found below).
```
\documentclass[fleqn]{article}
\usepackage{geometry}
\usepackage{amsmath}
\usepackage{tikz}
\usepackage{tikz-3dplot}
\usetikzlibrary{spy}
\begin{document}
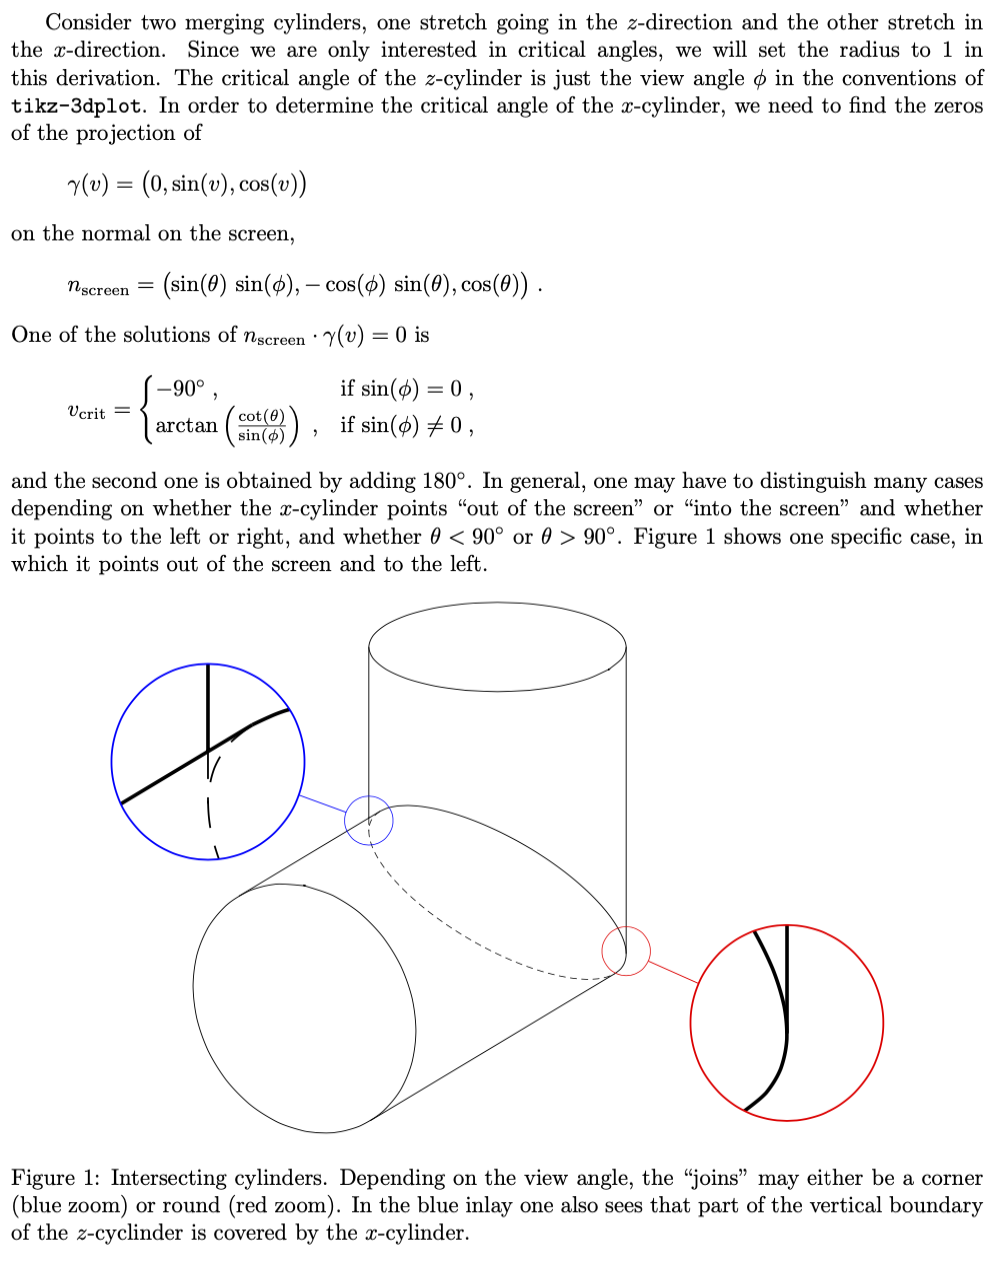
Consider two merging cylinders, one stretch going in the $z$-direction and the
other stretch in the $x$-direction. Since we are only interested in critical
angles, we will set the radius to 1 in this derivation. The critical angle of
the $z$-cylinder is just the view angle $\phi$ in the conventions of
\texttt{tikz-3dplot}. In order to determine the critical angle of the
$x$-cylinder, we need to find the zeros of the projection of
\[
\gamma(v)=\bigl(0,\sin(v),\cos(v)\bigr)
\]
on the normal on the screen,
\[
n_\mathrm{screen} =\bigl(\sin(\theta)\,\sin(\phi),
-\cos(\phi)\,\sin(\theta),\cos(\theta)\bigr)\;.
\]
One of the solutions of $n_\mathrm{screen}\cdot\gamma(v)=0$ is
\[
v_\mathrm{crit}=\begin{cases}
-90^\circ\;, &
\text{if $\sin(\phi)=0$}\;,\\
\arctan\left(\frac{\cot(\theta)}{\sin(\phi)}\right)\;, &
\text{if $\sin(\phi)\ne0$}\;,
\end{cases}
\]
and the second one is obtained by adding $180^\circ$. In general, one may have
to distinguish many cases depending on whether the $x$-cylinder points ``out of
the screen'' or ``into the screen'' and whether it points to the left or right,
and whether $\theta<90^\circ$ or $\theta>90^\circ$.
Figure~\ref{fig:IntersectingCylinders} shows one specific case, in which it points out of the screen and to the left.
\begin{figure}[h]
\centering
\begin{tikzpicture}[spy using outlines={circle, magnification=4,
size=3cm, connect spies}]
\tdplotsetmaincoords{70}{120}
\begin{scope}[tdplot_main_coords,
hidden/.style={draw,very thin,densely dashed},
visible/.style=draw,
declare function={R=2;hx=6;hz=4;
vcrit=180+(abs(cos(\tdplotmainphi))>0.01 ?
atan(cot(\tdplotmaintheta)/cos(\tdplotmainphi)) :
-90);
}]
% intersection
\draw[hidden] plot[variable=\t,domain=vcrit+180:vcrit,smooth]
({R*cos(\t)},{R*sin(\t)},{R*cos(\t)}) coordinate (p2);
\draw[visible] plot[variable=\t,domain=vcrit:vcrit-180,smooth]
({R*cos(\t)},{R*sin(\t)},{R*cos(\t)}) coordinate (p1);
% end of x-cylinder
\draw[visible] plot[variable=\t,domain=0:360,smooth cycle]
(hx,{R*sin(\t)},{R*cos(\t)});
%
\path
(hx,{R*sin(vcrit+180)},{R*cos(vcrit+180)}) coordinate (px1)
(hx,{R*sin(vcrit)},{R*cos(vcrit)}) coordinate (px2)
({R*cos(\tdplotmainphi)},{R*sin(\tdplotmainphi)},{R*cos(\tdplotmainphi)})
coordinate (p3)
({R*cos(\tdplotmainphi+180)},{R*sin(\tdplotmainphi+180)},{R*cos(\tdplotmainphi+180)})
coordinate (p4)
({R*cos(\tdplotmainphi)},{R*sin(\tdplotmainphi)},{hz})
coordinate (pz3)
({R*cos(\tdplotmainphi+180)},{R*sin(\tdplotmainphi+180)},{hz})
coordinate (pz4);
% end of z-cylinder
\draw[visible] plot[variable=\t,domain=0:360,smooth cycle]
({R*sin(\t)},{R*cos(\t)},hz);
\draw[hidden] (intersection of p4--pz4 and p1--px1) -- (p4);
\draw (p1) -- (px1) (p2) -- (px2)
% vertical boundaries
(p3) -- (pz3)
(intersection of p4--pz4 and p1--px1) -- (pz4);
\end{scope}
\spy [red] on (2,-0.9) in node at (4.5,-2);
\spy [blue] on (-2,1.1) in node at (-4.5,2);
\end{tikzpicture}
\caption{Intersecting cylinders. Depending on the view angle, the ``joins'' may
either be a corner (blue zoom) or round (red zoom). In the blue inlay one also
sees that part of the vertical boundary of the $z$-cyclinder is covered by the
$x$-cylinder.}
\label{fig:IntersectingCylinders}
\end{figure}
\end{document}
```
Here is a slight generalization that works for `theta<90` and `0<phi<180`.
```
\documentclass[tikz,border=3.14mm]{standalone}
\usepackage{tikz-3dplot}
\begin{document}
\foreach \Angle in {5,15,...,175}% {80}% {5,15,...,355}
{\tdplotsetmaincoords{70}{\Angle}
\begin{tikzpicture}[tdplot_main_coords,
hidden/.style={draw,very thin,densely dashed},
visible/.style=draw,
declare function={R=2;hx=6;hz=4;
vcrit=180+(abs(cos(\tdplotmainphi))>0.001 ?
atan(cot(\tdplotmaintheta)/cos(\tdplotmainphi)) :
-90);
}]
\pgfmathtruncatemacro{\iquadrant}{int(\tdplotmainphi/90)}
\typeout{\Angle:\iquadrant}
\path[tdplot_screen_coords,use as bounding box] (-6.5,-4.5) rectangle (6.5,7)
(-6.5,7) node[below right]{$\phi=\tdplotmainphi$, $q=\iquadrant$};
% intersection
\ifodd\iquadrant
\draw[hidden] plot[variable=\t,domain=vcrit+180:vcrit,smooth]
({R*cos(\t)},{R*sin(\t)},{R*cos(\t)}) coordinate (p2);
\draw[visible] plot[variable=\t,domain=vcrit:vcrit-180,smooth]
({R*cos(\t)},{R*sin(\t)},{R*cos(\t)}) coordinate (p1);
\else
\draw[hidden] plot[variable=\t,domain=vcrit:vcrit-180,smooth]
({R*cos(\t)},{R*sin(\t)},{R*cos(\t)}) coordinate (p1);
\draw[visible] plot[variable=\t,domain=vcrit+180:vcrit,smooth]
({R*cos(\t)},{R*sin(\t)},{R*cos(\t)}) coordinate (p2);
\fi
% end of x-cylinder
% something like this will be needed if the x-cylinder points "into the screen"
\ifnum\iquadrant>1
\ifnum\iquadrant=2
\draw[hidden] plot[variable=\t,domain=vcrit+180:vcrit,smooth]
(hx,{R*sin(\t)},{R*cos(\t)});
\draw[visible] plot[variable=\t,domain=vcrit:vcrit-180,smooth]
(hx,{R*sin(\t)},{R*cos(\t)});
\else
\draw[hidden] plot[variable=\t,domain=vcrit:vcrit-180,smooth]
(hx,{R*sin(\t)},{R*cos(\t)});
\draw[visible] plot[variable=\t,domain=vcrit+180:vcrit,smooth]
(hx,{R*sin(\t)},{R*cos(\t)});
\fi
\else
\draw[visible] plot[variable=\t,domain=0:360,smooth cycle]
(hx,{R*sin(\t)},{R*cos(\t)});
\fi
%
\path
(hx,{R*sin(vcrit+180)},{R*cos(vcrit+180)}) coordinate (px1)
(hx,{R*sin(vcrit)},{R*cos(vcrit)}) coordinate (px2)
({R*cos(\tdplotmainphi)},{R*sin(\tdplotmainphi)},{R*cos(\tdplotmainphi)})
coordinate (p3)
({R*cos(\tdplotmainphi+180)},{R*sin(\tdplotmainphi+180)},{R*cos(\tdplotmainphi+180)})
coordinate (p4)
({R*cos(\tdplotmainphi)},{R*sin(\tdplotmainphi)},{hz})
coordinate (pz3)
({R*cos(\tdplotmainphi+180)},{R*sin(\tdplotmainphi+180)},{hz})
coordinate (pz4);
% end of z-cylinder
\draw[visible] plot[variable=\t,domain=0:360,smooth cycle]
({R*sin(\t)},{R*cos(\t)},hz);
\draw[visible] (p1) -- (px1) (p2) -- (px2);
% vertical boundaries
\ifcase\iquadrant
\draw[hidden]
(intersection of p3--pz3 and p1--px1) -- (p3);
\draw[visible] (p4) -- (pz4)
(intersection of p3--pz3 and p1--px1) -- (pz3);
\or
\draw[hidden]
(intersection of p4--pz4 and p1--px1) -- (p4);
\draw[visible] (p3) -- (pz3)
(intersection of p4--pz4 and p1--px1) -- (pz4);
\or
\or
\fi
\end{tikzpicture}}
\end{document}
```