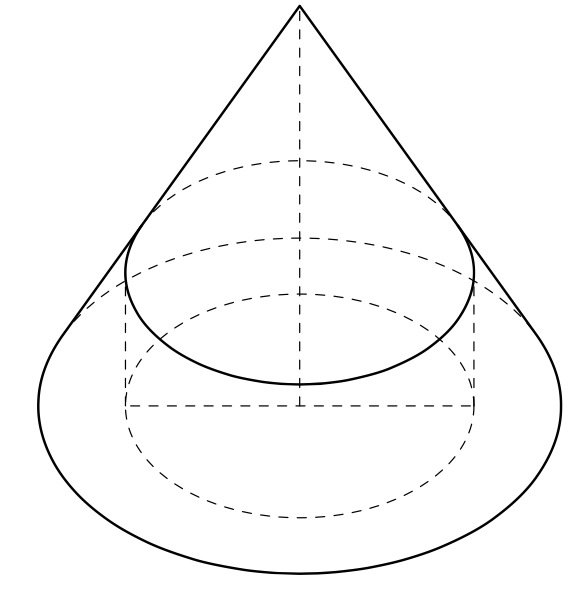
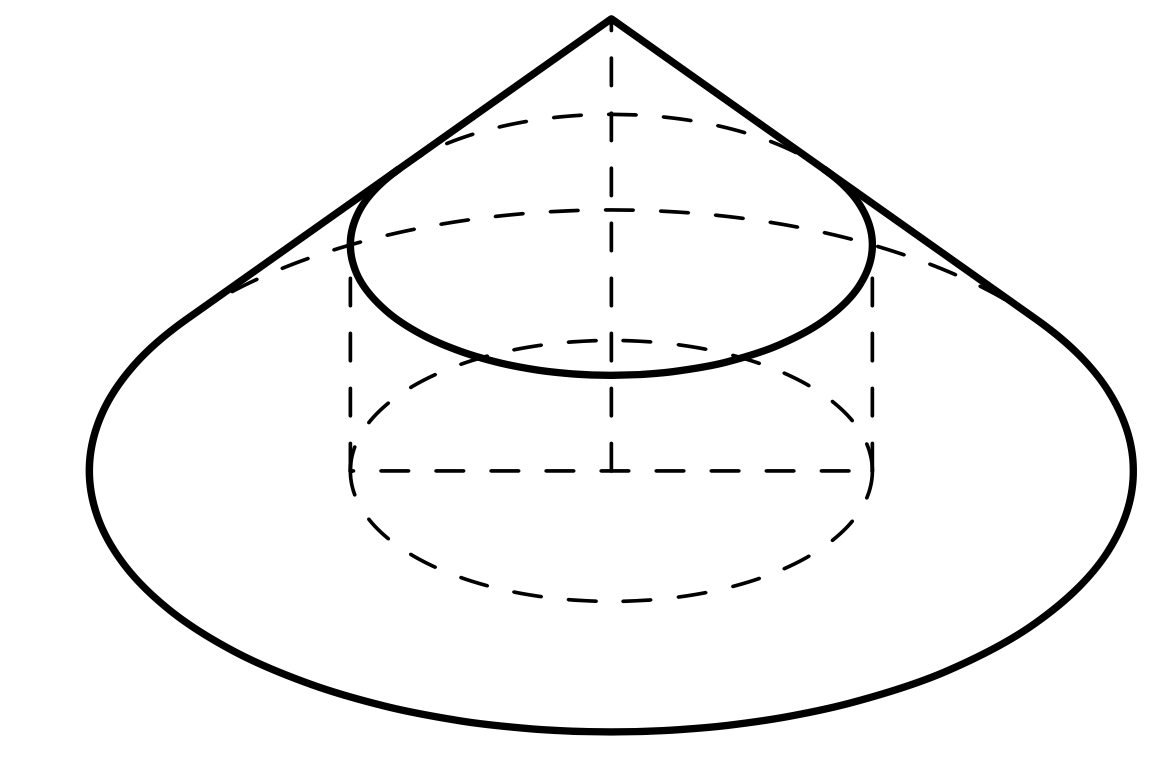
The main message is that you basically answered the question yourself by computing the critical angles of visibility for the larger cone. The same angles can be used for the smaller cone on the top.
The rest is just a series of minor remarks:
1. Instead of using `\th` and `\az` you can just use `\tdplotmaintheta` and `\tdplotmainphi` consistently (you are using the latter anyway). That's perhaps a bit less confusing.
2. I personally like to use `declare function` instead of a series of macros. Using macros is fine, of course, but if one is to use them, perhaps it is better to define them locally inside the `tikzpicture` so that you can copy the whole thing and embed it in another document without having to worry about overwriting some global macros.
3. You can just use the `min` and `max` functions instead of the `ifthenelse` stuff.
4. You can use the arcs from `tikz-3dplot` or "ordinary" arcs in planes from the `3d` library. However, I would not necessarily want to mix them as both of them have the same purpose.
```
\documentclass[border=1mm,tikz]{standalone}
\usepackage{tikz-3dplot}
\begin{document}
\tdplotsetmaincoords{50}{120}
\begin{tikzpicture}[tdplot_main_coords,line join = round, line cap = round,
hidden/.style={thin,dashed},visible/.style={thick,solid},
declare function={R=3;v=2*R;% parameters of the cone
h=v/3;r=(v-h)*R/v;% parameters of the cylinder
f=max(min(R*cot(\tdplotmaintheta)/v,1),-1);% auxiliary
phicrit=acos(f);% crititcal angles
phi1=90+\tdplotmainphi+phicrit;
phi2=90+\tdplotmainphi-phicrit;}]
\draw[hidden] (0,0,0) coordinate (O)
-- (0,0,v) coordinate (S);
\begin{scope}[canvas is xy plane at z=0]
\draw[hidden] (\tdplotmainphi:r)
arc[start angle=\tdplotmainphi,end angle=\tdplotmainphi+180,radius=r];
\draw[hidden] (\tdplotmainphi:r) coordinate(BR)
arc[start angle=\tdplotmainphi,end angle=\tdplotmainphi-180,radius=r]
coordinate(BL) -- cycle;
\draw[hidden] (phi1:R) coordinate (CL)
arc[start angle=phi1,end angle=phi2,radius=R]
coordinate (CR);
\draw[visible] (phi1:R)
arc[start angle=phi1,end angle=360+phi2,radius=R]
-- (S) -- cycle;
\end{scope}
%
\begin{scope}[canvas is xy plane at z=h]
\draw [hidden](BR) -- (\tdplotmainphi:r)
(BL) -- (\tdplotmainphi-180:r);
\draw[hidden] (phi1:r)
arc[start angle=phi1,end angle=phi2,radius=r];
\draw[visible] (phi1:r)
arc[start angle=phi1,end angle=360+phi2,radius=r];
\end{scope}
\end{tikzpicture}
\end{document}
```

Given the height of the cylinder, one can compute its radius, or the other way around.
```
\documentclass[border=1mm,tikz]{standalone}
\usepackage{tikz-3dplot}
\begin{document}
\tdplotsetmaincoords{60}{120}
\begin{tikzpicture}[tdplot_main_coords,line join = round, line cap = round,
hidden/.style={thin,dashed},visible/.style={thick,solid},
declare function={R=2;v=R;% base radius and height of the cone
r=R/2;% radius of the cylinder
h=(R-r)*v/R;%
f=max(min(R*cot(\tdplotmaintheta)/v,1),-1);% auxiliary
phicrit=acos(f);% crititcal angles
phi1=90+\tdplotmainphi+phicrit;
phi2=90+\tdplotmainphi-phicrit;}]
\draw[hidden] (0,0,0) coordinate (O)
-- (0,0,v) coordinate (S);
\begin{scope}[canvas is xy plane at z=0]
\draw[hidden] (\tdplotmainphi:r)
arc[start angle=\tdplotmainphi,end angle=\tdplotmainphi+180,radius=r];
\draw[hidden] (\tdplotmainphi:r) coordinate(BR)
arc[start angle=\tdplotmainphi,end angle=\tdplotmainphi-180,radius=r]
coordinate(BL) -- cycle;
\draw[hidden] (phi1:R) coordinate (CL)
arc[start angle=phi1,end angle=phi2,radius=R]
coordinate (CR);
\draw[visible] (phi1:R)
arc[start angle=phi1,end angle=360+phi2,radius=R]
-- (S) -- cycle;
\end{scope}
%
\begin{scope}[canvas is xy plane at z=h]
\draw [hidden](BR) -- (\tdplotmainphi:r)
(BL) -- (\tdplotmainphi-180:r);
\draw[hidden] (phi1:r)
arc[start angle=phi1,end angle=phi2,radius=r];
\draw[visible] (phi1:r)
arc[start angle=phi1,end angle=360+phi2,radius=r];
\end{scope}
\end{tikzpicture}
\end{document}
```

With some more recent additions to the [`3dtools` library](https://github.com/marmotghost/tikz-3dtools) the code can be condensed to
```
\documentclass[border=1mm,tikz]{standalone}
\usetikzlibrary{calc,3dtools}% https://github.com/marmotghost/tikz-3dtools
\begin{document}
\begin{tikzpicture}[3d/install view={phi=110,theta=70},line join = round, line cap = round,
declare function={R=2;v=R;% base radius and height of the cone
r=R/2;% radius of the cylinder
h=(R-r)*v/R;% height of the base of the upper circle
}]
\draw[3d/hidden] (0,0,0) coordinate (O) circle[radius=r]
-- (0,0,v) coordinate (S) (0,0,h) coordinate (H)
[3d/screen coords] (-r,0) -- (-r,0|-H) (r,0) -- (r,0|-H);
\path pic{3d/cone={r=R,h=v}} (0,0,h) pic{3d/cone={r=r,h/.evaluated=v-h}};
\end{tikzpicture}
\end{document}
```