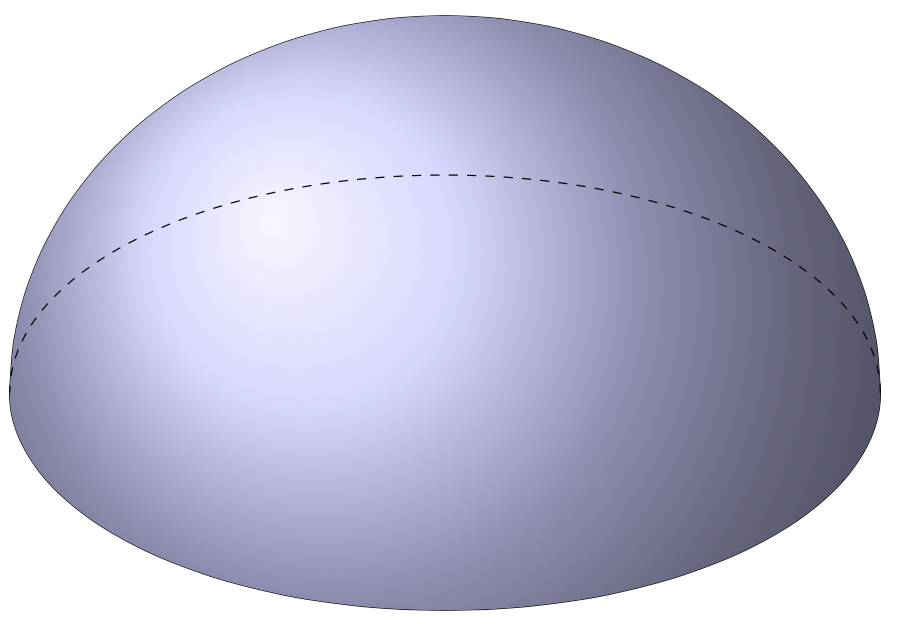
Let us parametrize the orientation of the hemisphere by its normal, `n_h`, i.e. a vector that is perpendicular to the plane of the boundary circle of the hemisphere. Then we can construct a vector that is orthogonal to `n_h` and the normal to the screen, `n_screen` by computing `\tilde e_1=n_h\times h_screen`, and normalizing it, `e_1=\tilde e_1/|\tilde e_1|`. This vector determines the place at which the line could turn from solid to dashed if one looks at the hemisphere from outside. The second basis vector for the plane of the screen will then be `e_2=e_1\times n_h`. This works as long as `n_h` and `n_screen` are not proportional to each other. Then we only need to draw some arcs in the `e_1-e_2` and `e_1-e_3` planes, where `e_3=n_h`. The normal vector is parametrized by two angles `alpha` and `gamma`, which can be thought of the rotation angles appearing in equation (2.3) of the `tikz-3dplot` manual, and `n_h` is the result of the rotation of `e_y` by these rotations.
```
\documentclass[tikz,border=3mm]{standalone}
\usepackage{tikz-3dplot}
\usetikzlibrary{3dtools}%https://github.com/marmotghost/tikz-3dtools
\begin{document}
\tdplotsetmaincoords{60}{110}
\begin{tikzpicture}[declare function={alpha=20;gamma=30;r=5;},
tdplot_main_coords,
outer/.style={ball color=blue!20},
inner/.style={inner color=black!60,outer color=black},
hidden/.style={gray,dashed}]
\path[overlay]
({sin(alpha)},{cos(alpha)*cos(gamma)},{-cos(alpha )*sin(gamma)})
coordinate (nh)
({sin(\tdplotmaintheta)*sin(\tdplotmainphi)},
{-1*sin(\tdplotmaintheta)*cos(\tdplotmainphi)},{cos(\tdplotmaintheta)})
coordinate (nscreen)
[3d coordinate={(tildee1)=(nh)x(nscreen)}];
\pgfmathsetmacro{\mydisc}{TD("(nh)o(nscreen)")}
\pgfmathsetmacro{\tmpnorm}{sqrt(TD("(tildee1)o(tildee1)"))}
\ifdim\tmpnorm pt<0.003pt
\typeout{Normal on hemisphere more or less proportional to normal on screen.}
\ifdim\mydisc pt<0pt% we are looking from outside
\path[tdplot_screen_coords,outer] (0,0) circle[radius=r];
\else
\path[tdplot_screen_coords,inner] (0,0) circle[radius=r];
\fi
\else
\pgfmathsetmacro{\invnorm}{1/\tmpnorm}
\path[overlay]
[3d coordinate={(e1)=\invnorm*(tildee1)},
3d coordinate={(e2)=(e1)x(nh)}];
\begin{scope}[x={(e1)},y={(e2)},z={(nh)}]
\ifdim\mydisc pt<0pt% we are looking from outside
\begin{scope}
\path[clip,draw,smooth]
({-r},0,0) arc[start angle=180,end angle=0,radius=r]
--plot[variable=\t,domain=0:180]
({r*cos(\t)},0,{-r*sin(\t)}) -- cycle;
\path[tdplot_screen_coords,outer] (0,0) circle[radius=r];
\end{scope}
\draw[dashed] (-r,0,0) arc[start angle=-180,end angle=0,radius=r];
\else% we are looking from inside
\begin{scope}
\path[clip,draw] circle[radius=r];
\path[tdplot_screen_coords,inner] (0,0) circle[radius=r];
\end{scope}
%
\begin{scope}
\path[clip,draw,smooth]
({-r},0,0) arc[start angle=180,end angle=0,radius=r]
--plot[variable=\t,domain=0:180]
({r*cos(\t)},0,{-r*sin(\t)}) -- cycle;
\path[tdplot_screen_coords,outer] (0,0) circle[radius=r];
\end{scope}
\fi
\end{scope}
\fi
\end{tikzpicture}
\end{document}
```
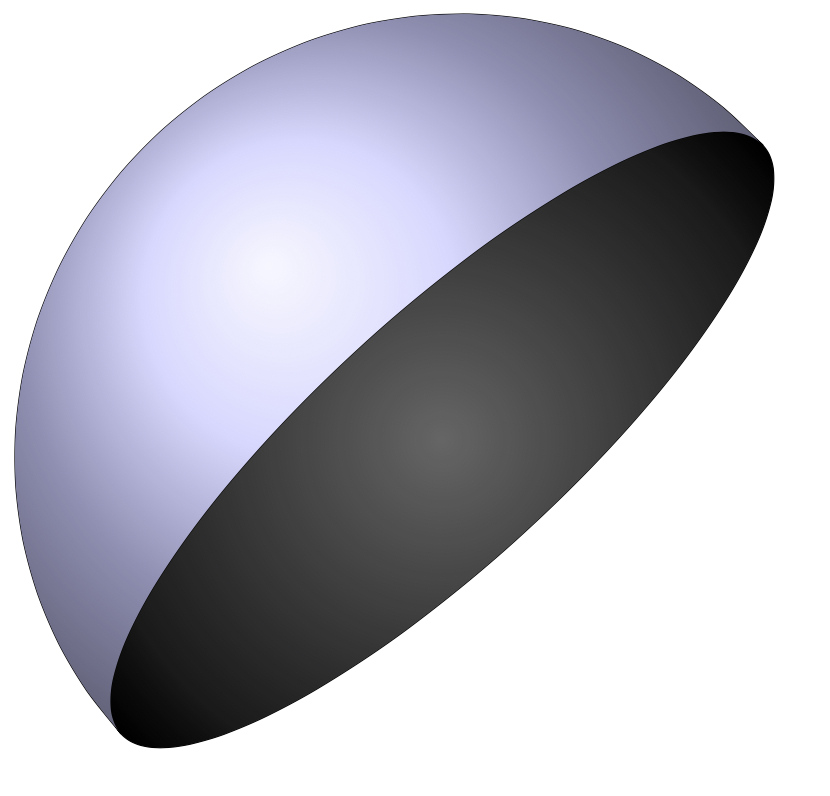
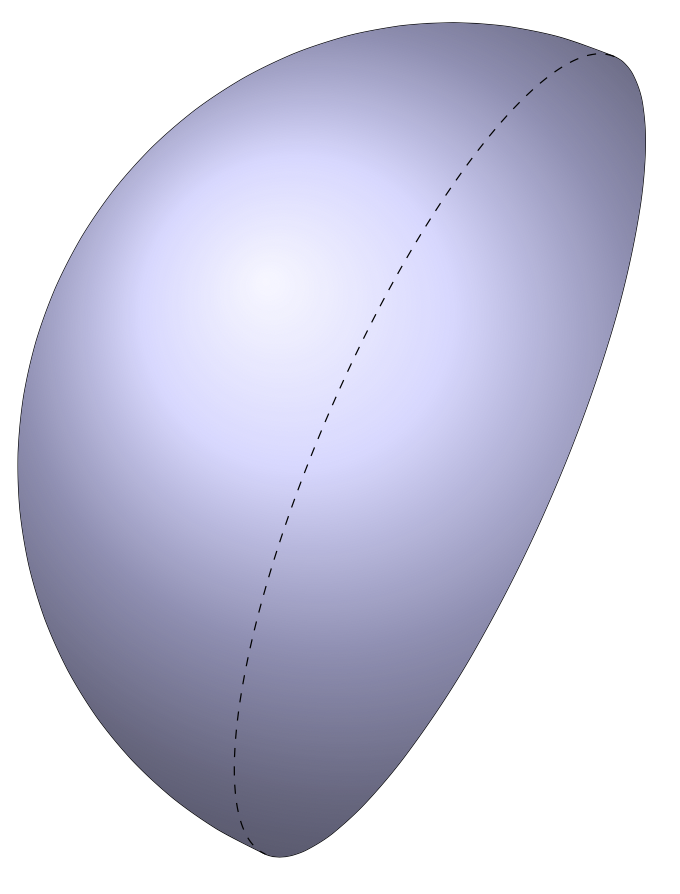
For `alpha=-20;` you get
You can also create a version in which you specify the normal in cartesian coordinates.
```
\documentclass[tikz,border=3mm]{standalone}
\usepackage{tikz-3dplot}
\usetikzlibrary{3dtools}
\begin{document}
\tdplotsetmaincoords{60}{110}
\begin{tikzpicture}[tdplot_main_coords,
declare function={r=5;},
outer/.style={ball color=blue!20},
inner/.style={inner color=black!60,outer color=black},
hidden/.style={gray,dashed}]
\path[overlay]
(0,0,-1) coordinate (nhun)
({sin(\tdplotmaintheta)*sin(\tdplotmainphi)},
{-1*sin(\tdplotmaintheta)*cos(\tdplotmainphi)},{cos(\tdplotmaintheta)})
coordinate (nscreen);
\pgfmathsetmacro{\nhnorm}{1/sqrt(TD("(nhun)o(nhun)"))}
\path[overlay,3d coordinate={(nh)=\nhnorm*(nhun)},
3d coordinate={(tildee1)=(nh)x(nscreen)}];
\pgfmathsetmacro{\mydisc}{TD("(nh)o(nscreen)")}
\pgfmathsetmacro{\tmpnorm}{sqrt(TD("(tildee1)o(tildee1)"))}
\ifdim\tmpnorm pt<0.003pt
\typeout{Normal on hemisphere more or less proportional to normal on screen.}
\ifdim\mydisc pt<0pt% we are looking from outside
\path[tdplot_screen_coords,outer] (0,0) circle[radius=r];
\else
\path[tdplot_screen_coords,inner] (0,0) circle[radius=r];
\fi
\else
\pgfmathsetmacro{\invnorm}{1/\tmpnorm}
\path[overlay]
[3d coordinate={(e1)=\invnorm*(tildee1)},
3d coordinate={(e2)=(e1)x(nh)}];
\begin{scope}[x={(e1)},y={(e2)},z={(nh)}]
\ifdim\mydisc pt<0pt% we are looking from outside
\begin{scope}
\path[clip,draw,smooth]
({-r},0,0) arc[start angle=180,end angle=0,radius=r]
--plot[variable=\t,domain=0:180]
({r*cos(\t)},0,{-r*sin(\t)}) -- cycle;
\path[tdplot_screen_coords,outer] (0,0) circle[radius=r];
\end{scope}
\draw[dashed] (-r,0,0) arc[start angle=-180,end angle=0,radius=r];
\else% we are looking from inside
\begin{scope}
\path[clip,draw] circle[radius=r];
\path[tdplot_screen_coords,inner] (0,0) circle[radius=r];
\end{scope}
%
\begin{scope}
\path[clip,draw,smooth]
({-r},0,0) arc[start angle=180,end angle=0,radius=r]
--plot[variable=\t,domain=0:180]
({r*cos(\t)},0,{-r*sin(\t)}) -- cycle;
\path[tdplot_screen_coords,outer] (0,0) circle[radius=r];
\end{scope}
\fi
\end{scope}
\fi
\end{tikzpicture}
\end{document}
```