i-one

I was always thinking that use of the `PIVOT` syntax is equivalent to use of the standard aggregation technique with a set of `CASE` expressions.
Indeed, in many aspects it is. Execution plans for `PIVOT` queries and standard aggregation queries look very similar, because of query optimizer transforms `PIVOT` to aggregation behind the scenes[^1].
But recently I came across the case, when there is the noticeable difference between use of the `PIVOT` and use of the standard aggregation. Let's make an example.
## **Setup**
The `[Data]` table will store what needs to be pivoted
```sql
CREATE TABLE [Data]
(
[Id] int IDENTITY(1,1) NOT NULL,
[ItemId] int NOT NULL,
[Quarter] tinyint NOT NULL,
[Value] decimal(12,2) NOT NULL,
CONSTRAINT [PK_Data] PRIMARY KEY CLUSTERED ([Id]),
CONSTRAINT [CK_Data_Quarter] CHECK ([Quarter] BETWEEN 1 AND 4)
);
CREATE UNIQUE INDEX [UX_Data] ON [Data] ([ItemId], [Quarter]);
```
For the purpose of this demonstration it will be populated with four million rows (one million items, each in four quarters)
```sql
INSERT INTO [Data] WITH (TABLOCK) ([ItemId], [Quarter], [Value])
SELECT itm.[N], q.[N], 100.0 * q.[N]
FROM [Numbers] itm
CROSS JOIN [Numbers] q
WHERE itm.[N] BETWEEN 1 AND 1000000
AND q.[N] BETWEEN 1 AND 4;
```
(you may find script for numbers table creation at the end of the post).
Following are the usual queries to get values of all items pivoted by quarters. The one that uses standard aggregation
```sql
SELECT
[ItemId],
[Q1] = MAX(CASE [Quarter] WHEN 1 THEN [Value] END),
[Q2] = MAX(CASE [Quarter] WHEN 2 THEN [Value] END),
[Q3] = MAX(CASE [Quarter] WHEN 3 THEN [Value] END),
[Q4] = MAX(CASE [Quarter] WHEN 4 THEN [Value] END)
FROM [Data]
GROUP BY [ItemId];
```
and the one that uses `PIVOT` syntax
```sql
WITH d AS (
SELECT [ItemId], [Quarter], [Value]
FROM [Data]
)
SELECT
[ItemId],
[1] AS [Q1],
[2] AS [Q2],
[3] AS [Q3],
[4] AS [Q4]
FROM d
PIVOT (MAX([Value]) FOR [Quarter] IN ([1], [2], [3], [4])) pvt;
```
## **Requirement**
The requirement, however, is not just to get pivoted data, there is the need to update another table with pivoted data additionally. The `[AnnualData]` table will serve as our target
```sql
CREATE TABLE [AnnualData]
(
[ItemId] int NOT NULL,
[Q1] decimal(12,2) NOT NULL,
[Q2] decimal(12,2) NOT NULL,
[Q3] decimal(12,2) NOT NULL,
[Q4] decimal(12,2) NOT NULL,
CONSTRAINT [PK_AnnualData] PRIMARY KEY NONCLUSTERED ([ItemId])
);
```
and it will be populated with one million rows
```sql
INSERT INTO [AnnualData] WITH (TABLOCK) ([ItemId], [Q1], [Q2], [Q3], [Q4])
SELECT p.[N], 0.0, 0.0, 0.0, 0.0
FROM [Numbers] p
WHERE p.[N] BETWEEN 1 AND 1000000;
```
Let's update `[AnnualData]` table using standard aggregation and `PIVOT` syntax, and compare.
## **Standard Aggregation**
First we will update the target table using standard aggregation. This is the query to perform the task
```sql
WITH stdAgg AS (
SELECT
[ItemId],
[Q1] = MAX(CASE [Quarter] WHEN 1 THEN [Value] END),
[Q2] = MAX(CASE [Quarter] WHEN 2 THEN [Value] END),
[Q3] = MAX(CASE [Quarter] WHEN 3 THEN [Value] END),
[Q4] = MAX(CASE [Quarter] WHEN 4 THEN [Value] END)
FROM [Data]
GROUP BY [ItemId]
)
UPDATE t
SET
[Q1] = p.[Q1],
[Q2] = p.[Q2],
[Q3] = p.[Q3],
[Q4] = p.[Q4]
FROM [AnnualData] t
INNER JOIN stdAgg p ON p.[ItemId] = t.[ItemId]
OPTION (MAXDOP 1, USE HINT('DISALLOW_BATCH_MODE'));
```
(options `MAXDOP 1` and `DISALLOW_BATCH_MODE` are used in this and the next query to reduce variance between two approaches).
This is the execution plan of the above update query
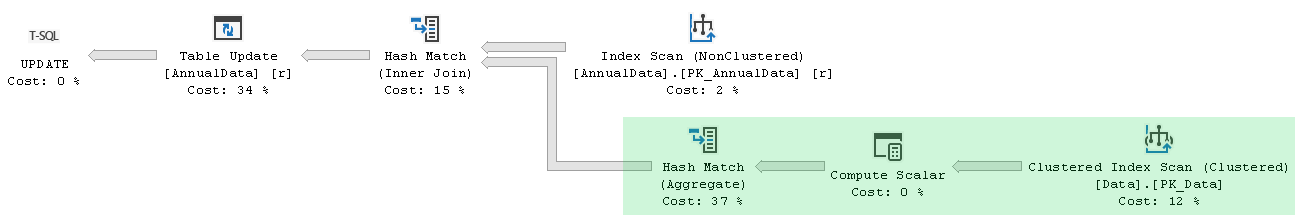
Estimated cost of the generated plan is **124.452** units on my system. Highlighted in green is the part that performs data aggregation, it is joined then via Hash Match with non-clustered primary key of the target table to get identifiers of rows being updated, and then row identifiers along with aggregated values flow to Table Update. There is something special (invisible) about this plan also, that we will reveal shortly.
Meanwhile let's turn statistics information on
```sql
SET STATISTICS IO, TIME ON;
```
and capture run-time metrics of the query
```none
Table 'AnnualData'. Scan count 1, logical reads 1002234, physical reads 0, ...
Table 'Workfile'. Scan count 0, logical reads 0, physical reads 0, ...
Table 'Worktable'. Scan count 0, logical reads 0, physical reads 0, ...
Table 'Data'. Scan count 1, logical reads 13406, physical reads 0, ...
SQL Server Execution Times:
CPU time = 5300 ms, elapsed time = 5328 ms.
```
for subsequent comparison.
## **PIVOT Syntax**
Now its `PIVOT`'s turn to perform the same task, but let's reset data before, to make initial conditions equal
```sql
UPDATE [AnnualData]
SET [Q1] = 0.0, [Q2] = 0.0, [Q3] = 0.0, [Q4] = 0.0;
```
Our second update query is
```sql
WITH d AS (
SELECT [ItemId], [Quarter], [Value]
FROM [Data]
),
pvtAgg AS (
SELECT
[ItemId],
[1] AS [Q1],
[2] AS [Q2],
[3] AS [Q3],
[4] AS [Q4]
FROM d
PIVOT (MAX([Value]) FOR [Quarter] IN ([1], [2], [3], [4])) pvt
)
UPDATE t
SET
[Q1] = p.[Q1],
[Q2] = p.[Q2],
[Q3] = p.[Q3],
[Q4] = p.[Q4]
FROM [AnnualData] t
INNER JOIN pvtAgg p ON p.[ItemId] = t.[ItemId]
OPTION (MAXDOP 1, USE HINT('DISALLOW_BATCH_MODE'));
```
Its execution plan is following
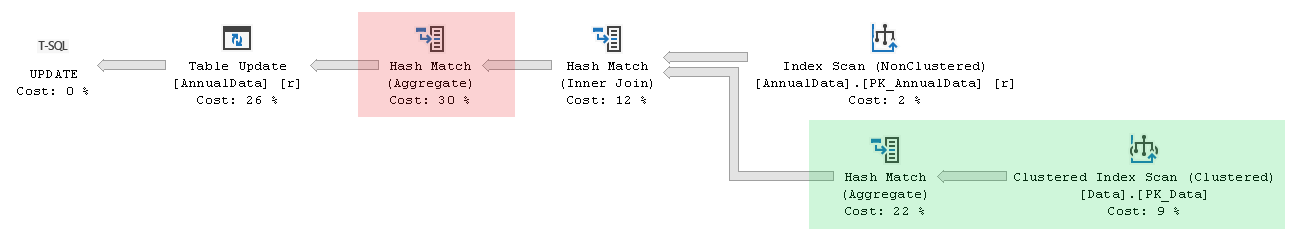
In this case estimated cost of the generated execution plan is **161.205** units. There is the part that performs `PIVOT` aggregation (highlighted in green) and join to primary key of the target table as well. All these things are similar to what we had for standard aggregation, but there is the additional Hash Match (Aggregate) operator right before Table Update also.
If we take a look at properties of this additional operator, we can see that it performs `ANY` aggregation[^2]
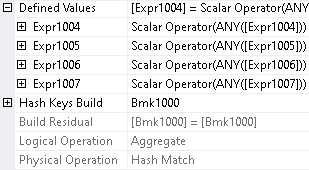
Query optimizer added it to ensure that each row of the target table is updated just once.
But why we haven't seen it in standard aggregation plan? The reason is that this additional aggregation is not really necessary. Target table is joined to aggregated data on `p.[ItemId] = t.[ItemId]` and joined columns have distinct values in their data sources. In the target table it is guaranteed by primary key, and in the aggregated data it is guaranteed by aggregation itself. So, our join is a one-to-one join and cannot produce duplicated rows.
Actually update query that uses standard aggregation had this additional aggregation initially, but it was removed by `GbAggToPrj` rule during simplification stage (that invisible thing). Update query that uses `PIVOT` syntax does not benefit from this optimization, because of transformation of `PIVOT` construct to standard aggregation happens at a later optimization stage[^3], when this rule is not available.
There is no doubt that additional aggregation will not come for free. But how huge is the impact?
Run-time statistics of the query
```none
Table 'AnnualData'. Scan count 1, logical reads 1002234, physical reads 0, ...
Table 'Worktable'. Scan count 0, logical reads 0, physical reads 0, ...
Table 'Workfile'. Scan count 0, logical reads 0, physical reads 0, ...
Table 'Data'. Scan count 1, logical reads 13406, physical reads 0, ...
SQL Server Execution Times:
CPU time = 5813 ms, elapsed time = 5850 ms.
```
show higher, for about 10%, execution times. Due to additional Hash Match operator, `PIVOT` update query is also more hungry for memory
```xml
<MemoryGrantInfo
SerialRequiredMemory="3072" SerialDesiredMemory="478040"
RequiredMemory="3072" DesiredMemory="478040"
RequestedMemory="478040" GrantedMemory="478040" MaxUsedMemory="218856"
GrantWaitTime="0"
...
/>
```
in comparison to standard aggregation update query
```xml
<MemoryGrantInfo
SerialRequiredMemory="2048" SerialDesiredMemory="337184"
RequiredMemory="2048" DesiredMemory="337184"
RequestedMemory="337184" GrantedMemory="337184" MaxUsedMemory="134272"
GrantWaitTime="0"
...
/>
```
and has additional possibility to spill to *tempdb* in unfortunate circumstances.
## **Schema Adjustment**
I deliberately designed tables in such a way, that encourages query optimizer to use Hash Match physical operation for aggregation and join, to give query execution engine more work to do. With better designed schema, theoretically, the impact of additional aggregation should be less pronounced.
Let's make some adjustments to the indexes on our tables
```sql
CREATE UNIQUE INDEX [UX_Data] ON [Data] ([ItemId], [Quarter]) INCLUDE ([Value])
WITH (DROP_EXISTING = ON);
CREATE UNIQUE CLUSTERED INDEX [PK_AnnualData] ON [AnnualData] ([ItemId])
WITH (DROP_EXISTING = ON);
```
With the above indexes in place, execution plan of the update query that uses standard aggregation changed to
Its estimated cost is **68.3728** units, and following is its run-time statistics
```none
Table 'AnnualData'. Scan count 1, logical reads 6078, physical reads 0, ...
Table 'Data'. Scan count 1, logical reads 11898, physical reads 0, ...
SQL Server Execution Times:
CPU time = 2641 ms, elapsed time = 2652 ms.
```
which will serve as our new baseline.
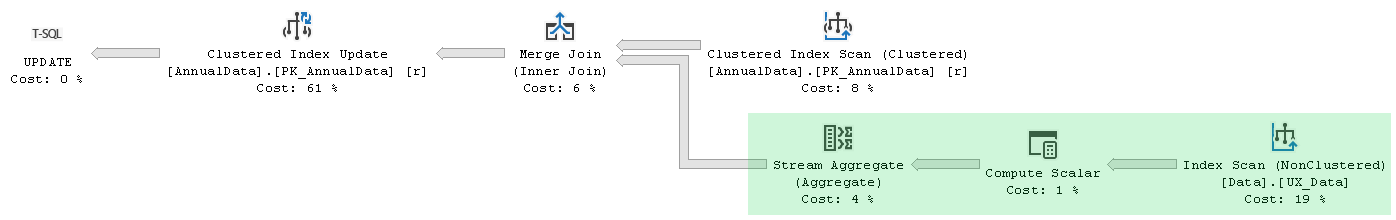
Execution plan of the `PIVOT` update query became following
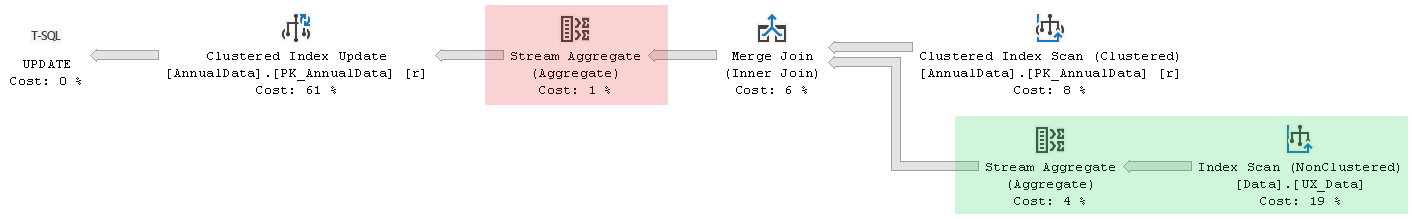
Its estimated cost is **68.9728** units, which is just tiny bit higher. Additional aggregation is represented by Stream Aggregate this time, which is ideal in this case. My expectation was that its impact will be hardly measurable.
But run-time statistics surprised me
```none
Table 'AnnualData'. Scan count 1, logical reads 5987886, physical reads 0, ...
Table 'Data'. Scan count 1, logical reads 11898, physical reads 0, ...
SQL Server Execution Times:
CPU time = 8222 ms, elapsed time = 8729 ms.
```
`PIVOT` update query with very similar execution plan turned out to be much slower and featured millions of additional logical reads over the `[AnnualData]` table. What is the problem?
The thing is that clustered index `[PK_AnnualData]` presents on both read and update sides of the execution plans, but the ways it is processed by query execution engine differ for the two queries.
## **Processing Details**
Before we get into essential details of processing, let's capture information returned by `sys.dm_db_index_physical_stats` data management function for the `[PK_AnnualData]` index
| index_depth | index_level | page_count | record_count |
| -----------:| -----------:| ----------:| ------------:|
| 3 | 0 | 6064 | 1000000 |
| 3 | 1 | 12 | 6064 |
| 3 | 2 | 1 | 12 |
to have these numbers near at hand.
### Update with Standard Aggregation
Following are the locks used on `[AnnualData]` table during statement execution
| event_seq | event_name | res_type | mode | res_descr |
| ---------:| ---------- |:--------:|:----:| --------- |
| 24478 | lock_acquired | OBJECT | IX ||
| 24479 | lock_acquired | PAGE | U | 1:148312 |
| 24480 | lock_acquired | PAGE | X | 1:148312 |
| 24481 | lock_acquired | PAGE | U | 1:148313 |
| 24482 | lock_released | PAGE | NL | 1:148312 |
| 24483 | lock_acquired | PAGE | X | 1:148313 |
| 24484 | lock_acquired | PAGE | U | 1:148314 |
| 24485 | lock_released | PAGE | NL | 1:148313 |
| 24486 | lock_acquired | PAGE | X | 1:148314 |
| 24487 | lock_acquired | PAGE | U | 1:148315 |
| 24488 | lock_released | PAGE | NL | 1:148314 |
| ... |||||
So, execution engine takes `U`-lock on a data page on the read side of the execution plan to read a row, then this lock is upgraded to `X`-lock on the update side and row is updated. When reading rows on a page is done, execution engine steps to the next one, and when updating rows on a page is done, corresponding lock is released. And so on, page by page, until all data pages processed.
Below is the difference of snapshots of information returned by `sys.dm_db_index_operational_stats` data management function for the `[PK_AnnualData]` index before and after update statement execution
| leaf_update_count | range_scan_count | singleton_lookup_count | page_lock_count | row_lock_count | page_latch_wait_count |
| -----------------:| ----------------:| ----------------------:| ---------------:| ---------------:| ---------------------:|
| 1000000 | 1 | 0 | 12128 | 0 | 0 |
where 12128 page locks correspond to 6064 processed leaf pages multiplied by two, because of two locks (`U` and then `X`) are taken for each leaf page, i.e. 12128 = 6064 * 2.
This is what we have in the actual execution plan for Clustered Index Scan node
```xml
<RunTimeCountersPerThread Thread="0"
ActualRows="1000000"
ActualRowsRead="1000000"
...
ActualLogicalReads="6078"
...
/>
```
where 6078 logical reads correspond to sum of number of pages at all index levels plus one, i.e. 6078 = (1 + 12 + 6064) + 1.
And this is what we have for Clustered Index Update node
```xml
<RunTimeCountersPerThread Thread="0"
ActualRows="1000000"
...
ActualLogicalReads="0"
...
/>
```
thing to note here is that update side does not perform reading.
### Update with PIVOT
Locking on `[AnnualData]` table is different for `PIVOT` update query
| event_seq | event_name | res_type | mode | res_descr | has_waiters | dur_mcs | latch_counters |
| ---------:| ---------- |:--------:|:----:| --------- |:-----------:| -------:| -------------- |
| 5030341 | lock_acquired | OBJECT | IX |||||
| 5030342 | lock_acquired | PAGE | U | 1:148312 ||||
| 5030343 | latch_suspend_begin | BUF | EX | 1:148312 | False || KP:0 SH:1 UP:0 EX:0 DT:0 |
| 5030344 | latch_suspend_end | BUF | EX | 1:148312 | False | 9 | KP:1 SH:0 UP:0 EX:1 DT:0 |
| 5030345 | lock_acquired | PAGE | U | 1:148312 ||||
| 5030346 | lock_acquired | PAGE | X | 1:148312 ||||
| 5030347 | lock_released | PAGE | NL | 1:148312 ||||
| 5030348 | latch_suspend_begin | BUF | EX | 1:148312 | False || KP:0 SH:1 UP:0 EX:0 DT:0 |
| 5030349 | latch_suspend_end | BUF | EX | 1:148312 | False | 3 | KP:1 SH:0 UP:0 EX:1 DT:0 |
| 5030350 | lock_acquired | PAGE | U | 1:148312 ||||
| 5030351 | lock_acquired | PAGE | X | 1:148312 ||||
| 5030352 | lock_released | PAGE | NL | 1:148312 ||||
| ... ||||||||
Execution engine takes `U`-lock on a data page on the read side of the execution plan. What follows next are the things that happen on the update side. There is suspended `SH` to `EX` page latch conversion, which happens for each row on the page, except the last one. This is followed by `U`-lock on page upgraded to `X`-lock, which is then released. All of the latter performed for **each row** on this data page. The rest of the data pages processed in the same way.
Difference of snapshots of information returned by `sys.dm_db_index_operational_stats` data management function for the `[PK_AnnualData]` index before and after update statement execution in this case shows following
| leaf_update_count | range_scan_count | singleton_lookup_count | page_lock_count | row_lock_count | page_latch_wait_count |
| -----------------:| ----------------:| ----------------------:| ---------------:| ---------------:| ---------------------:|
| 1000000 | 1 | 1000000 | 2006064 | 0 | 993936 |
where 2006064 page locks correspond to 6064 leaf pages locks on the read side, plus two page locks (`U` and `X`) obtained for each row on the update side, i.e. 2006064 = 6064 + 1000000 * 2. And 993936 page latch waits correspond to 1000000 rows except one on each of 6064 leaf pages, i.e. 993936 = 1000000 - 6064. Additionally there are 1000000 singleton lookups, which is also reflected in the actual execution plan in properties of Clustered Index Update node
```xml
<RunTimeCountersPerThread Thread="0"
ActualRows="1000000"
ActualRowsRead="1000000"
...
ActualLogicalReads="3000000"
...
/>
```
where 3000000 logical reads correspond to 1000000 seeks through three levels of the index tree, i.e. 3000000 = 1000000 * 3.
So, in this case update side of the execution plan performs reading, that was not there for the standard aggregation update, where we had `ActualLogicalReads="0"` and no `ActualRowsRead` attribute at all for the Clustered Index Update node.
There is rather high number of logical reads on the read side in the properties of Clustered Index Scan node also
```xml
<RunTimeCountersPerThread Thread="0"
ActualRows="1000000"
ActualRowsRead="1000000"
...
ActualLogicalReads="2987886"
...
/>
```
which I was not able to understand and decompose. It becomes normal 6078 reads though, if data is not reset before (a case of non-updating update).
Page latch waits are reflected in wait statistics of the actual execution plan also
```xml
<WaitStats>
<Wait WaitType="PAGELATCH_EX" WaitTimeMs="2084" WaitCount="993936" />
</WaitStats>
```
Adding `TABLOCK` hint to `[AnnualData]` table helps with excessive page locking, but does not improve performance significantly, because of latch waits, high number of reads on read side and reading on update side remain.
To sum this section up, with rearranged indexes `PIVOT` update query performance turned out to be much worse than performance of the standard aggregation update query due to different processing seemingly, rather than additional aggregation itself. Taking and releasing *page* lock for each *row* in the table to process all table rows looks like a bug to me, as well as going to seek for something that has just been read. Write a comment, if you think different.
## **Conclusion**
Certain optimizations aren't available for queries that use `PIVOT` syntax due to the moment at which query optimizer transforms `PIVOT` construct to standard aggregation. Update queries that use `PIVOT` as a source of data may suffer from under-optimization in particular. The impact, in comparison to standard aggregation, can be either noticeable or negligibly small performance drop, depending on the schema, amount of data processed, execution plan chosen and other factors.
---
[^1]: [PIVOT Query Plans](https://docs.microsoft.com/en-us/archive/blogs/craigfr/pivot-query-plans) by Craig Freedman
[^2]: [Undocumented Query Plans: The ANY Aggregate](https://www.sql.kiwi/2011/07/undocumented-query-plans-the-any-aggregate.html) by Paul White
[^3]: **Internals** section of [this answer](https://dba.stackexchange.com/a/164852/99746) by Paul White
### Auxiliary Script
```sql
CREATE TABLE [Numbers]
(
[N] int,
CONSTRAINT [PK_Numbers] PRIMARY KEY CLUSTERED ([N])
);
INSERT INTO [Numbers] WITH (TABLOCK) ([N])
SELECT TOP (1000000)
ROW_NUMBER() OVER (ORDER BY @@SPID)
FROM sys.all_columns a,
sys.all_columns b,
sys.all_columns c,
sys.all_columns d;
```