sql-server add tag
Joe Obbish
My understanding is that a query executing at DOP 4 will never use more than 4 CPU cores at a time during execution, unless you're doing something like using UDFs, CLR, or other odd things. This implies that the CPU time for a DOP 4 query will never be greater than four times the elapsed time. One could say that a perfectly efficient query will have CPU time = 4 * elapsed time and any lower ratio suggests that a wait event could be eliminated to improve query execution time.

Today I happened to notice a DOP 4 query reporting a CPU time greater than 4 times the elapsed time. This has been reproduced on SQL Server 2019 and 2017 on five different machines by three different people. On my home computer I see the following:

> SQL Server Execution Times:  
> CPU time = 10594 ms,  elapsed time = 2355 ms.

I don't think this is a measurement problem with `SET STATISTICS TIME ON`. I see the same ratio when looking at QueryTimeStats in an Estimated Plan Plus™. An example plan is [here](https://www.brentozar.com/pastetheplan/?id=r1AhxvSOI).

It also seems to be backed up by Resource Monitor during query execution, although I admit I can't tell which workers are using the CPU. The following screenshot is from my machine with 8 physical cores and no hyperthreading:

![aaaa.PNG](/image?hash=46d7ec5e8fb193064cd8c4e6c61e7dee467f8f0dc4f3785db41acbaf01b796f5)

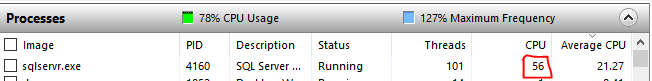
How can this MAXDOP 4 query have CPU time greater than 4X the elapsed time? Is it a possible bug in SQL Server? This [answer](https://dba.stackexchange.com/questions/205643/degree-of-parallelism-and-scheduler-usage) by Paul White suggests that SQL Server 2000 had a bug in this area.

Code to reproduce the issue is below. It may not work on all machines. I suggest having as little other work running as possible on the server and having a physical core count that exceeds 4.


    -- data prep
    CREATE TABLE [dbo].[N](
        N [int] NOT NULL,
    PRIMARY KEY CLUSTERED
    (N ASC) WITH (DATA_COMPRESSION = PAGE)
    );
     
     INSERT INTO [dbo].[N] WITH (TABLOCK)
    SELECT TOP (1000000) ROW_NUMBER() OVER (ORDER BY (SELECT NULL))
    FROM master..spt_values t1
    CROSS JOIN master..spt_values t2
    OPTION (MAXDOP 1);
     
    CREATE TABLE dbo.TopAnswers (ID BIGINT, INDEX C CLUSTERED COLUMNSTORE);
    
    GO 
     
    -- the problematic query
    INSERT INTO dbo.TopAnswers WITH (TABLOCK)
    SELECT 2
    FROM (
        VALUES
        (1), (1), (1), (1), (1), (1), (1), (1),
        (1), (1), (1), (1), (1), (1), (1), (1),
        (1), (1), (1), (1), (1), (1), (1), (1),
        (1), (1), (1), (1), (1), (1), (1), (1)
    ) v(x)
    CROSS APPLY (
        SELECT TOP (1048576) 2 val
        FROM (
            SELECT N
            FROM dbo.N
     
            UNION ALL
     
            SELECT N
            FROM dbo.N
        ) ca2
    ) ca
    OPTION (FORCE ORDER, LOOP JOIN, NO_PERFORMANCE_SPOOL, MAXDOP 4);
Top Answer
Paul White
DOP limits the number of schedulers that can be used by ***additional parallel workers***. These are threads used to execute the statement that are not provided by the originating session.

For example, a parallel query that runs at DOP 4 on a SQL Server instance with 8 schedulers available would use 4 schedulers for the parallel workers. The query as a whole could use 5 schedulers -- 1 provided by the session plus the 4 for the additional parallel workers.

---

The test query has three branches:

1. One is parallel marked. Four additional parallel workers are assigned to run operators in this parallel branch. Each of these workers may run on one of the 4 designated schedulers.
2. One branch is a *serial* branch containing just the *Constant Scan*. This is counted as an additional worker because its thread is not provided by the originating session. The scheduler for this (serial) branch is assigned from the pool of four schedulers available to additional threads.
3. The final branch (to the left of the *Gather Streams*) is run on the worker provided by the originating session. This worker may run on a scheduler that is distinct from the four schedulers used for the additional parallel workers.

The final branch worker is responsible for pulling rows up from the rest of the plan. It doesn't do anything special with those rows (there are no plan operators to the left of the *Gather Streams*). Nevertheless, it is required to consume those rows to make the statement run to completion.

Because this worker consumes *packets* of rows from the *Gather Streams* exchange (which also buffers packets), it can overlap in time with workers filling packets on the producer side (which are running on a distinct set of schedulers). The CPU time consumed by this final thread accounts for the extra work you see.

This is an example of the statement running at DOP 2 on an instance with schedulers tied to CPUs:

![CPU graph](/image?hash=c417c1eaa879cbc78faf04e49793625321c1dabeba0bc5e5f548b14afb1e5728)

The green-shaded cores are parallel workers. The yellow-shaded core is the connection-provided worker. The query time stats for this execution were 30742ms CPU and 13591ms elapsed (at DOP 2). This is a ratio of 2.26.

Enter question or answer id or url (and optionally further answer ids/urls from the same question) from

Separate each id/url with a space. No need to list your own answers; they will be imported automatically.