PeterVandivier

Using `OFFSET ... NEXT` over a non-unique sort column results in predictable & repeatable variance under different execution context in the presence of of parallelism. Why does this behavior occur and is there a productive inference that can be made about the optimizer based on this behavior?

#### Some Background

I received a support ticket saying something like...

> I'm auditing some financial statements for `$time_period` and getting inconsistent results. When I execute `$stored_procedure`, I get $100; but when I run the `$ad-hoc-code` found _inside_ the SP with the same parameters, I get $200. _Why is SQL wrong?!_

The underlying proc was paginating results by sorting on a non-unique column. Job done right? I closed the ticket as "_Don't sort on a non-unique column_".

#### But why was it repeatable?

In reproducing & minifying the behavior, I was able to consistently induce...

* a `ScanDirection="FORWARD"` for a **STORED-PROC EXECUTION** ([execution plan][ptp-STORED_PROC]) and
* a `ScanDirection="BACKWARD"` for an **AD-HOC F5** ([execution plan][ptp-AD_HOC_F5]).

...given the following pre-requisites...

* Non-unique clustered index
* With a non-clustered index
* In a parallel plan
* With sufficient padding data
  * ~60k rows is the smallest dataset I've minified to as yet
      * give me some credit I was starting vs ~200 million rows

...which causes reproducible variance give the repro dataset.

These are the most noticable variances in [the diff of the SQLPlans][sqlplan-diff], although there are others (but I'm gonna feel real bad if this is somehow parameter sniffing & I just don't know how to read plans).

The fact that I can reproducably cause this specific change in the execution plan at this level is a little disorienting. To repeat from the **Summary**...

> Why does this behavior occur and is there a productive inference that can be made about the optimizer based on this behavior?


## [Reproduction][gist-repro]

> TODO: fix [fiddle][fiddle-repro] batching (55k more to go 😬)
>
> TODO: plain-language describe stats histogram of psuedononimized data

very long fiddle here: https://dbfiddle.uk/?rdbms=sqlserver_2017&fiddle=4726813c2d4d6c23fd5d7a50756de4b6&hide=2

## Other Trivia

1. "_In the wild_", column `[xx]` was a `datetime2(7)` column (presumably some enterprising dev thought clustering in this was was equivalent to uniqueness). I modified it to `int` for readability while minifying the repro
2. This question has sat as a stub for about a year as of posting. If you care for the deep cut, start [here][1]

[ptp-STORED_PROC]:
https://www.brentozar.com/pastetheplan/?id=r15VllyRB
[ptp-AD_HOC_F5]: https://www.brentozar.com/pastetheplan/?id=SJcS-lJAB
[gist-repro]: https://gist.github.com/petervandivier/a5497e7a1e8e52635499f10996c9355a
[1]: https://github.com/petervandivier/hello-world/commit/8f3143efff657dfe167493e137105c55b7cbf90a
[fiddle-repro]: https://dbfiddle.uk/?rdbms=sqlserver_2017&fiddle=49b7f1c1d154473b7dd42c73c6b07f0d
[sqlplan-diff]: https://gist.githubusercontent.com/petervandivier/a5497e7a1e8e52635499f10996c9355a/raw/5496f4fee31118b518382b1f48e194712eaa24c2/sqlplan.diff
Top Answer
Josh Darnell

In this specific case, the difference between the two plans can be explained by a *poor estimate* caused by local variables. Kendra Little talks about this here: [Why Local Variables are Bad for Tuning Stored Procedures](https://www.brentozar.com/archive/2014/06/tuning-stored-procedures-local-variables-problems/)
> Local variables effectively “anonymize” the value being passed in on a parameter in SQL Server. It’s like you’re using Optimize for Unknown all the time.
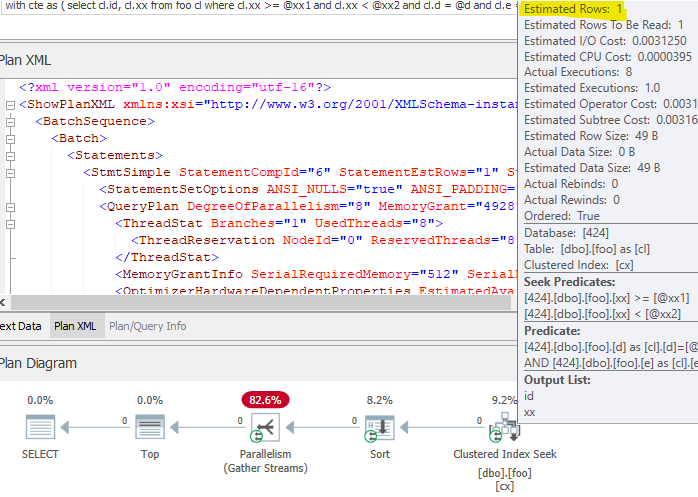
The stored procedure version shows a 1-row estimate on the (forward) clustered index seek:

The optimizer is okay with "sorting" these results, because there will be so few, and letting the `TOP` operator do the rest.
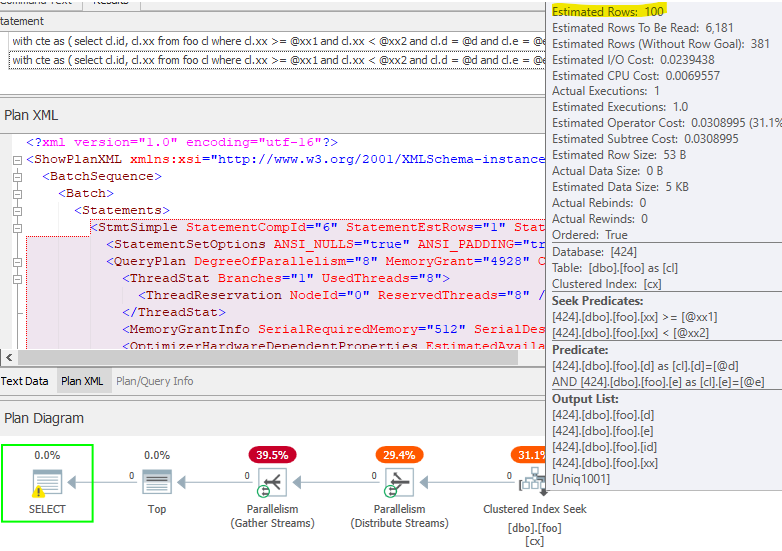
The local variable version shows a 100-row *guess* on the (backward) clustered index seek:

Because the potential number of rows is higher, the optimizer decides to read the index backwards rather than sorting.
You can get the forward scan plan with the ad-hoc query by adding `OPTION (RECOMPILE)` or using the literal values in the query.
---
As you noted in your question, the non-deterministic results are because of the lack of a unique sort column to be used for paging, and the different access patterns in the different plans. In this case, the second plan isn't parallel at all really, and accesses the clustered index backwards from the first plan, which explains why you might see different results.
---
As a funny side note, the odd no-op parallel branch in the second plan is due to a `FILTER` operator that was present in the plan at some point during optimization, but was later pushed into the seek as a residual predicate. You can see the parallel `FILTER` by enabling trace flag 9130 to prevent the predicate push from happening:
