i-one

I encountered the issue recently, occasionally a complex query was taking tens of seconds to execute, while most of the time it was taking less than a second for SQL Server to produce the result. Such behavior can be caused by a variety of reasons. As it turned out later, long compilation was the thing causing sudden slowdowns.
Okay, but long compilation can have various flavors. Statistics update is the most common suspect among them probably. Saying in advance, yes, statistics update was the accomplice in the happening "crime", but not guilty. It can take noticeable time to update statistics on a large table, but no, particular statistics were on the table that is not large. There is the nuance though, statistics update was performed over `varbinary(max) FILESTREAM` column.
## **Repro**
One can use the following simple setup for reproduction (assuming that FILESTREAM stuff is enabled and configured for the SQL Server instance and database).
The only table needed is
```sql
CREATE TABLE [Files]
(
[Id] int IDENTITY(1,1) NOT NULL,
[Uid] uniqueidentifier ROWGUIDCOL NOT NULL,
[Data] varbinary(max) FILESTREAM NULL,
CONSTRAINT [PK_Files] PRIMARY KEY CLUSTERED ([Id]),
CONSTRAINT [UQ_Files] UNIQUE NONCLUSTERED ([Uid])
)
FILESTREAM_ON [Filestream];
```
that will be populated with just 10000 rows
```sql
INSERT INTO [Files] WITH (TABLOCK) ([Uid], [Data])
SELECT TOP (10000)
NEWID(), 0x
FROM sys.all_columns a
CROSS JOIN sys.all_columns b;
```
And the following simple query will serve as the subject
```sql
SELECT [Id]
FROM [Files]
WHERE [Data] IS NULL;
```
Execution plan of the query is straightforward
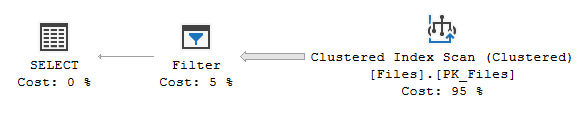
Filter performs `[Data] IS NULL` predicate evaluation over rows supplied from Clustered Index Scan.
This is what I got for the first run
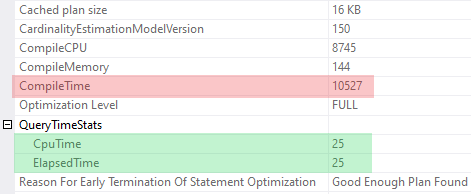
So, the query itself is pretty fast, it takes just **25 msec** on my machine to run it to completion, but it takes **10527 msec** to compile it.
## **Analysis**
Monitoring query execution with XE Profiler reveals statistics collection over `[Data]` column happening before query itself is executed
| event_seq | event_name | statement | duration_mcs |
| ---------:| ---------- | --------- | ------------:|
| ... ||||
| 233 | sp_statement_completed | SELECT StatMan([SC0], [LC0]) FROM ... | 10515482 |
| ... ||||
| 247 | sql_statement_completed | SELECT [Id] FROM [Files] WHERE [Data] IS NULL | 25582 |
As one can see, it lasts **10515 msec**, that is **99.9 %** of the compilation time (**10527 msec**). Statistics collection is initiated, because of query optimizer needs to evaluate selectivity of the `[Data] IS NULL` predicate.
This is the full statement captured for statistics
```sql
SELECT
StatMan([SC0], [LC0])
FROM (
SELECT TOP 100 PERCENT
CONVERT(
[varbinary](200),
SUBSTRING ([Data], 1, 100)
++substring([Data], case when LEN([Data])<=200 then 101 else LEN([Data])-99 end, 100)
) AS [SC0],
datalength([Data]) AS [LC0]
FROM [dbo].[Files] WITH (READUNCOMMITTED)
ORDER BY [SC0]
) AS _MS_UPDSTATS_TBL
OPTION (MAXDOP 16)
```
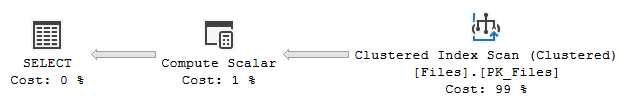
And this is corresponding execution plan captured
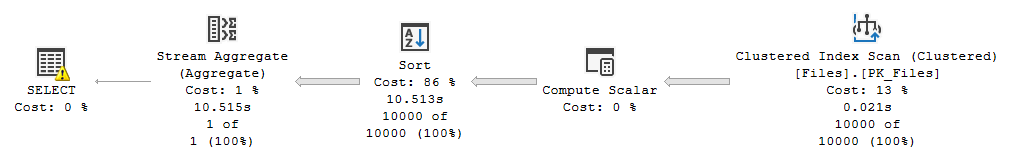
It may look surprisingly that Sort takes so much time for just 10000 rows, but not the Sort itself is the problem. Things begin getting uncovered in the plan properties
```xml
<WaitStats>
<Wait WaitType="PREEMPTIVE_OS_CREATEFILE" WaitTimeMs="4887" WaitCount="100000"></Wait>
<Wait WaitType="PREEMPTIVE_OS_CLOSEHANDLE" WaitTimeMs="3072" WaitCount="100000"></Wait>
<Wait WaitType="PREEMPTIVE_OS_GETFILESIZE" WaitTimeMs="1315" WaitCount="100000"></Wait>
<Wait WaitType="PREEMPTIVE_OS_FILEOPS" WaitTimeMs="308" WaitCount="20000"></Wait>
</WaitStats>
<QueryTimeStats ElapsedTime="10515" CpuTime="8738"></QueryTimeStats>
```
About **91 %** of the statistics collection time (**9582 msec** in total) is spent in various `PREEMPTIVE_OS_` waits.
Further profiling of query compilation with the PerfView tool provides additional understanding of the things happening internally. Following is the breakdown of time spent in the SQL Server internal methods
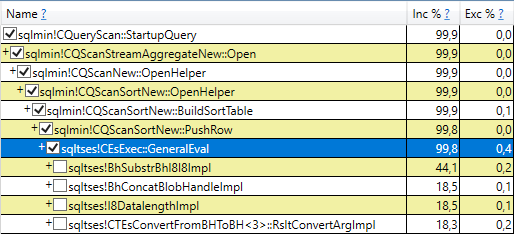
Internal method `sqltses!CEsExec::GeneralEval` here is what performs computation of expressions aliased as `[SC0]` and `[LC0]` in the statistics collection statement. It is easy to guess about purpose of the methods below it
+ `sqltses!BhSubstrBhI8I8Impl` performs `SUBSTRING`
+ `sqltses!BhConcatBlobHandleImpl` performs `CONCAT`
+ `sqltses!I8DatalengthImpl` performs `DATALENGTH`
+ `sqltses!CTEsConvertFromBHToBH<3>::RsltConvertArgImpl` performs `CONVERT`
Breakdown of time spent in the `SUBSTRING` internal method
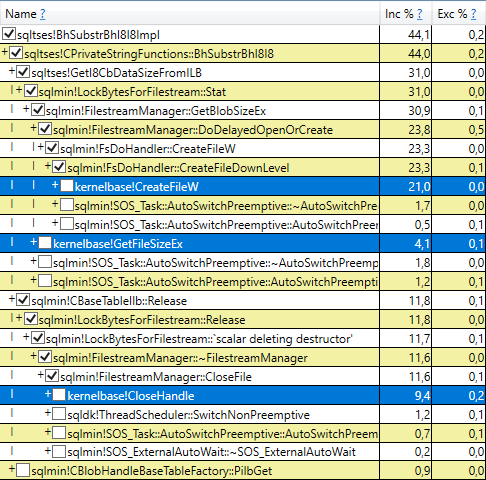
shows that most of the time is spent in the following methods
+ `kernelbase!CreateFileW`
+ `kernelbase!GetFileSizeEx`
+ `kernelbase!CloseHandle`
(things are similar for the `CONCAT`, `DATALENGTH` and `CONVERT` functions).
The entire picture is probably became completed for those people who have dealt with Windows API ever. Whenever FILESTREAM data needs to be accessed, SQL Server asks Filestream Manager to open underlying file. Once data access is completed, SQL Server asks Filestream Manager to close underlying file. Filestream Manager in its turn relies on OS capabilities, those calls to `kernelbase` methods is where SQL Server passes control to Windows OS (`CreateFileW` opens underlying file and returns file handle, and `CloseHandle` releases the handle associated with a file).
Entire time spent in those file-accessing kernel routines


totals 43.3 % + 9.7 % + 23.5 % = **76.5 %** of compilation time.
From the `PREEMPTIVE_OS_CREATEFILE` wait information
```xml
<Wait WaitType="PREEMPTIVE_OS_CREATEFILE" WaitTimeMs="4887" WaitCount="100000"></Wait>
```
it is possible to infer average time of the individual file open event: 4887 msec / 100000 = **48.87 mcsec**. Similarly, from the `PREEMPTIVE_OS_CLOSEHANDLE` wait information
```xml
<Wait WaitType="PREEMPTIVE_OS_CLOSEHANDLE" WaitTimeMs="3072" WaitCount="100000"></Wait>
```
time of the individual file close event: 3072 msec / 100000 = **30.72 mcsec**.
These (tens microseconds order) times sound quite low individually, but unfortunately there are a lot of file accessing operations performed. My hardware is in no way top, and my SSD is somewhat average consumer level, so on a better hardware these individual (and overall) times could be lower.
Disappointing thing is that same individual underlying files opened and closed multiple times, per each reference of `[Data]` column in the expression. Possible improvement would be doing it once instead, per row.
## **Accessing FILESTREAM Data**
So, accessing FILESTREAM data can cause some delays. One can reaffirm it with a more directed query
```sql
SELECT
[Id],
DATALENGTH([Data]),
DATALENGTH([Data]),
DATALENGTH([Data]),
DATALENGTH([Data]),
DATALENGTH([Data])
FROM [Files];
```
Its execution plan is trivial
and features
```xml
<WaitStats>
<Wait WaitType="PREEMPTIVE_OS_CREATEFILE" WaitTimeMs="2448" WaitCount="50000" />
<Wait WaitType="PREEMPTIVE_OS_CLOSEHANDLE" WaitTimeMs="1513" WaitCount="50000" />
<Wait WaitType="PREEMPTIVE_OS_GETFILESIZE" WaitTimeMs="733" WaitCount="50000" />
</WaitStats>
<QueryTimeStats CpuTime="4326" ElapsedTime="5177" />
```
Again, about **91 %** of the time (**4694 msec** in total) is spent in `PREEMPTIVE_OS_` waits.
## **Back to Problem**
Returning back to the subject query
```sql
SELECT [Id]
FROM [Files]
WHERE [Data] IS NULL;
```
what can one do about its sudden slowness? Below are some possible options that can be used depending on what is allowed or acceptable.
### Disable Automatic Statistics Update
One possible option is to disable automatic statistics update for `[Data]` column. Subject query should be executed at least once obviously, so that statistics are created.
Corresponding statistics name should be determined first (by querying system DMVs for example), and then passed to `sp_autostats` along with the table name and `OFF` parameter
```sql
EXEC sp_autostats '[Files]', 'OFF', '_WA_Sys_00000003_5D60DB10';
```
Disabled statistics update may eventually lead to wrong estimations, so, in a more complex case, materialization of intermediate results into temporary table may be necessary.
### Add Computed Column
The other possible option is to add persisted computed column for `[Data] IS NULL` expression
```sql
ALTER TABLE [Files]
ADD [HasData] AS
ISNULL(
IIF([Data] IS NULL, CAST(0 AS bit), CAST(1 AS bit)),
CAST(0 AS bit)
)
PERSISTED;
```
Subject query will have to be rewritten as
```sql
SELECT [Id]
FROM [Files]
WHERE [HasData] = 0
OPTION (QUERYTRACEON 176);
```
(trace flag 176 is necessary to prevent computed column expansion[^1]).
### Make FILESTREAM Column Non-Nullable
Worth to consider option is making `FILESTREAM` column non-nullable, if possible. It may require serious changes in application logic, but the benefit is that problem will be eliminated at the root.
## **Final Thoughts**
Evaluation of `IS NULL` (or `IS NOT NULL`) predicate over `varbinary(max) FILESTREAM` column does not require access to underlying files, query execution engine fulfills it by testing corresponding bit in the null bitmap structure of a record. It was unexpected a little to get know that underlying files can be touched during query compilation, even if query itself does not accesses FILESTREAM data.
[^1]: [Properly Persisted Computed Columns](https://sqlperformance.com/2017/05/sql-plan/properly-persisted-computed-columns) by Paul White